North Macedonia Key Figures
- Population:
- 1.79 million
- GDP growth rate:
- 2.76 %/year
- Energy independence:
- 31.5%
Data of the last year available: 2024
- Total consumption/GDP:*
- 54.2 (2015=100)
- CO2 Emissions:
- 3.84 tCO2/cap
- Rate of T&D power losses:
- 16.2%
* at purchasing power parity
View all macro and energy indicators in the North Macedonia energy report
North Macedonia Energy News
View all news, archive your new and create your own daily newsletters only on your topics/countries of interest with Key Energy Intelligence
North Macedonia Energy Research
- Macedonia's Energy & Climate Policy Framework: North Macedonia aims to boost renewables to 38% by 2030 and 42% by 2040, aligning with EU energy policies. The country is transitioning from lignite, enhancing energy efficiency, and liberalising markets while integrating with regional energy systems. New laws support renewables, energy communities, and climate goals.
- Macedonia's Energy Companies: State-owned ESM dominates North Macedonia's power sector, generating 58% of electricity, primarily from lignite. Private firms control oil and gas supply. Transmission and distribution are state-managed, with EVN Austria operating distribution. The energy market is liberalised, with multiple suppliers.
- Macedonia's Energy Supply & Demand: North Macedonia's energy mix relies heavily on lignite (42%) and hydro (24%), with declining coal use and rising solar capacity. The country imports all oil and gas, facing reduced consumption and increased renewables. Electricity demand has dropped, with households now the largest consumers. GHG emissions remain stable but below 1990 levels.
- Macedonia's Energy Use & Price by Sector: Oil dominates North Macedonia's energy use, particularly in transport. Final energy demand has stabilised post-2022, with transport and households as the primary consumers. Industrial demand has declined significantly, while transport demand has surged. Energy prices, influenced by global trends, remain below EU averages, with subsidies mitigating residential electricity price rises.
- Macedonia's Issues & Prospects: North Macedonia is expanding its energy sector with new gas, solar, and wind projects, while phasing out lignite. It aims to boost electricity capacity, including nuclear SMRs, and enhance grid interconnections. Hydropower and storage projects are also in development.
Benefit from up to 2 000 up-to-date data series for 186 countries in Global Energy & CO2 data
A data overview is available in the global energy statistics app
North Macedonia Total Energy Production & Consumption
Total energy consumption declined by 4% to 2.6 Mtoe in 2024, after fluctuating around 2.7 Mtoe from 2013 to 2023. In 2024, the country's energy consumption per capita was 1.4 toe, 44% below the European average.
Graph: Primary Consumption Trends by Energy Source
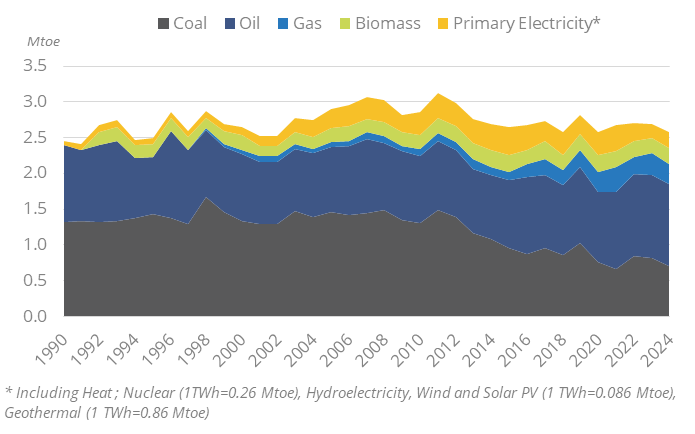
Source: North Macedonia energy report
Interactive Chart North Macedonia Total Energy Production & Consumption
Source: Global Energy & CO2 data
Benefit from up to 2 000 up-to-date data series for 186 countries in Global Energy & CO2 data
View the detailed fondamentals of the market at country level (graphs, tables, analysis) in the North Macedonia energy report
North Macedonia Oil Production & Consumption
Oil supplies are entirely covered by imports. North Macedonia ended crude oil importsin 2013, when the 50 kb/d OKTA refinery was shut down. Oil product imports have been fluctuating at around 1.3 Mt since 2019 (1.2 Mt in 2024),up from an average of 1.1 Mt/year over 2014-2018). They mostly come from Greece (86% in 2024), Bulgaria (10%), and Albania (2%).
Source: North Macedonia energy report
Interactive Chart North Macedonia Crude Oil Production & Consumption
Source: Global Energy & CO2 data
Interactive Chart North Macedonia Refined Oil Products Production & Consumption
Source: Global Energy & CO2 data
Benefit from up to 2 000 up-to-date data series for 186 countries in Global Energy & CO2 data
Additionally, for more detailed information on refineries, you can request a sample of our EMEA Refineries Dataset
North Macedonia Natural Gas Production & Consumption
All the gas is imported through an interconnection point with Bulgaria. Gas imports grew by over 9%/year between 2000 and 2021, before falling in 2022 due to lower consumption. Until 2020, all the gas was imported from Russia through the international corridor 8 through Ukraine, Moldova, Romania, and Bulgaria at Zidilovo (capacity of 655 mcm/year). Since 2020, North Macedonia received gas from Bulgaria through the TurkStream gas pipeline from Russia to Turkey and extended to Bulgaria.
Source: North Macedonia energy report
Interactive Chart North Macedonia Gas Production & Consumption
Source: Global Energy & CO2 data
Benefit from up to 2 000 up-to-date data series for 186 countries in Global Energy & CO2 data
Additionally, for more detailed information on the LNG trade, you can request a sample of our EMEA LNG Trade Dataset
North Macedonia Coal and Lignite Production & Consumption
After a 23% rise in 2022 - when surging gas prices raised lignite demand from the power sector by 36% - lignite production fell in 2023 (-21%) and 2024 (-19%) to 3.2 Mt, i.e. halfits 2010 level. Overall, it has been declining by 7%/year since 2011.
Source: North Macedonia energy report
Interactive Chart North Macedonia Coal and Lignite Production & Consumption
Source: Global Energy & CO2 data
Benefit from up to 2 000 up-to-date data series for 186 countries in Global Energy & CO2 data
View the detailed consumption trends at country level (graphs, tables, analysis) in the North Macedonia energy report
North Macedonia Renewable in % Electricity Production
According to its NECP, this share should reach 38% in 2030 and 42% in 2040, with the following targets by sector: 66% for electricity in 2030 (80% in 2040), 45% for heating and cooling (43% in 2040), and 7% in transport (up to 17% for transport including electric vehicles in 2030). In 2023, renewables covered 20% of final energy consumption, including 32% for electricity, 38% for heating and cooling, and less than 0.1% for transport. The 2030 target is higher than the overall 2030 target of 31% adopted in 2022 by the Energy Community to achieve climate neutrality by 2050.
Source: North Macedonia energy report
Interactive Chart North Macedonia Share of Renewables in Electricity Production (incl hydro)
Source: Global Energy & CO2 data
Benefit from up to 2 000 up-to-date data series for 186 countries in Global Energy & CO2 data
Learn more about renewables in the European Battery Market Analysis
North Macedonia GHG emissions and CO2 emissions
North Macedonia's NECP (2022) retains the GHG emission cut targets set in the 2021 NDC, i.e., reducing GHG emissions by 51% by 2030 compared to 1990 levels (from 12.5 MtCO2eq to 6.1 MtCO2eq), which corresponds to an 82% cut in net GHG emissions (taking into account LULUCF) between 1990 and 2030 (from around 10 MtCO2eq to 2.2 MtCO2eq). Total GHG emissions should be cut by 66% in the energy sector, by 45% in industrial processes and Product Use, 29% in agriculture, 95% in forest and land use, and 21% in the waste sector.
Source: North Macedonia energy report
Interactive Chart North Macedonia CO2 emissions
Source: Global Energy & CO2 data
Benefit from up to 2 000 up-to-date data series for 186 countries in Global Energy & CO2 data
View the detailed consumption trends at country level (graphs, tables, analysis) in the North Macedonia energy report