EnerOutlook is a free online application providing long-term energy trends through interactive maps and graphs.
Browse and visualise annual data up to 2050 on primary energy consumption for all energies. Access global and regional forecasts for primary and final energy consumption by source, power generation and CO2 emissions and indicators. View up-to-date energy data and robust projections at the world and region levels, based on the globally recognised POLES model.
Under our EnerBlue scenario—which reflects NDCs and other national climate pledges—you can analyse the key drivers shaping the long-term evolution of energy systems up to 2050. This outlook spans 7 regional groupings and 5 key countries: Brazil, Canada, Hungary, Türkiye and Vietnam.
Access projections with EnerBlue scenario, based on the successful achievement of NDCs:
- On total primary and final consumption, with details for electricity and renewable energies;
- On CO2 emissions;
- On energy and climate indicators;
- Covering the whole world with 7 regional groupings;
- With a dedicated tab for snapshots on specific countries;
- Up to 2050;
- Free data export in *.xls files to make your own analysis.
- With detailed results from the EnerBlue scenario, as well as key figures from the EnerBase and EnerGreen scenarios.
Some Key Figures
- Renewable energy sources will account for almost half of global primary consumption by 2050.
- Renewables account for more than 80% of electricity generation worldwide in 2050. Renewable-based electricity will largely dominate the mix by 2050, reaching between 68% and 87% in various regions in EnerBlue scenario considering announced policies and pledges. This development will happen quickly, as the power sector is one of the first expected to decarbonise.
- Electricity will account for nearly 40% of final energy consumption by 2050 as global industries rapidly shift away from fossil fuels.
- Data Centres: The digital revolution is accelerating power demand. Data centres will consume up to 2 300 TWh by 2050, led heavily by growth in North America and Asia-Pacific.
- Carbon-Free Power: Decarbonisation is reaching new heights: 92% of electricity will be carbon-free, and 50% of hydrogen will be produced through clean electrolysis by 2050.
- Lower CO2 Emissions: These combined milestones represent the primary levers to successfully curb resulting global CO2 emissions.
|
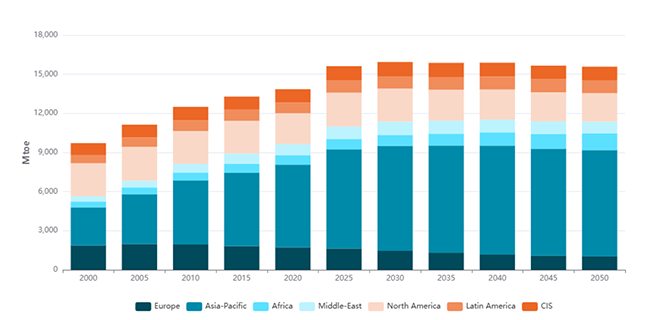
Total primary energy consumption projections (Mtoe)
|
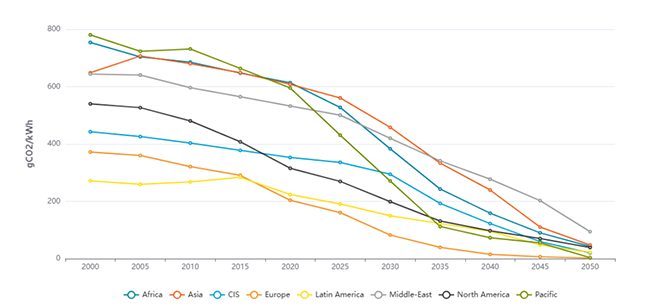
CO2 intensity of electricity generation (gCO2/kWh) 2050 projections
|
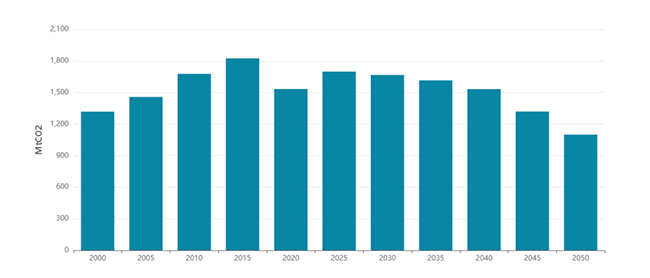
Total CO2 emissions (incl. industrial processes)* trends
EnerBlue scenario - *Latin America |