
EnerFuture provides annual energy projections up to 2050 for 50+ countries, across 3 distinct scenarios. Our service offers clear insights into the future of energy demand, electricity generation, prices, and GHG emissions by energy source, sector, and power generation at both country and regional levels. The service provides a consistent set of data based on an exclusive and well-proven modelling methodology.
Useful tool to assess the evolution and drivers of energy markets worldwide, EnerFuture will help you define your strategic business decisions.
New
Latest Updates:
- All prices are available in current (USD or EUR) and Constant (USD25 or EUR25) currencies.
- New projections accounting for the most recent developments:
- Energy & climate policy developments, including up-to-date NDCs and policies (as of end 2025)
- The US-Israel Iran War and its impacts on fossil fuel supply and prices (as of early April 2026)
- Data Centres - country-level modelling including electricity demand, cost-based competition for supply, breakdown by type and end-use
- The dataset includes the latest historical data.
World decarbonisation indicators in 2050*
*EnerBlue/NDCs scenario
Example:
- CO2 emissions per capita: 1.55 tCO2/cap
- CO2 intensity to GDP: 0.05 kgCO2/$15ppp
- CO2 intensity of electricity generation: 50.90 gCO2/kWh
Those indices are available at world, region and country level for 3 energy scenarios in the EnerFuture database
Energy Demand Forecasting: Oil products consumption of transport (ktoe) from 2010 to 2050 in India

Power Generation Forecasting: Electric capacity from solar (MW) from 2010 to 2050 - Indonesia and Chile

Wholesale electricity prices in South Korea, Japan, United States, Germany – EnerBlue

End-user natural gas prices in buildings and industry in Mexico – EnerBase, EnerBlue, EnerGreen

Electrolysis-based hydrogen production

Country Snapshot: Total CO2 emissions in the Middle-east

GDP deflator: inflation projections hypothesis - EnerBlue scenario

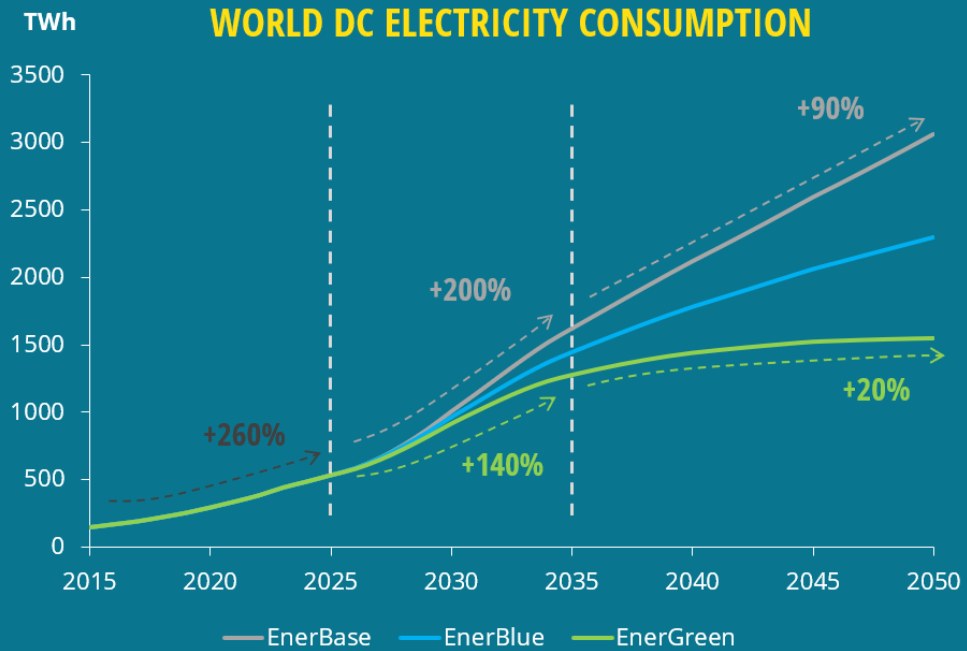
Power consumption for data centres – World – EnerBase, EnerBlue, EnerGreen scenarios

Easy access to the comprehensive and complex POLES model:
- POLES is a worldwide reference for energy systems modelling and forecasting
- The model uses dynamic simulation of supply and demand with endogenous calculation of energy prices
- Detailed description of the POLES model included
- Modelling methodology and scenarios are made explicit
- Independent view: Enerdata is not linked to any governmental body nor to any energy company
- Can be benchmarked against other sources
- Regular updates
- Global forecast consistent with country-specific energy balances
- Support from Enerdata’s energy systems modelling experts
- Global coverage of 65+ countries and aggregates
- Three detailed scenarios
- Projections up to 2050, based on the globally recognised POLES model and on historical data from 2000 to 2024, updated each year
- All energies covered: oil, gas, coal, electricity, hydrogen, and biomass; Renewable energies focus, including series on demand, supply, and indicators
- Carbon captured and CO2 emissions forecasts by fuel and by sector
- Energy transition indicators: energy and CO2 intensities, share of renewables, degree of electrification in final energy demand
- Power mix forecasts (capacities and production)
Both fossil fuels and renewable energies covered - All prices available in current (USD or EUR) and Constant (USD25 or EUR25) currencies.
- GDP deflator (inflation projections hypothesis): the projections take into account assumption on inflation and exchange rate trends.
- User-friendly interface with 24/7 online access
- Unlimited data exports in .xlsx and .csv formats to integrate with your own databases and models
- Data available in graphs and tables for country and scenario benchmarking (expanded data visualisation options with custom pie charts, line graphs and bar graphs directly in our online interface)
- Country snapshots downloadable in PDF
Optional modules:
- MACC: Long-term Marginal Abatement Cost Curves : Calculate the different levels of emissions reductions that can be reached with different carbon price levels for any given year, country and/or sector.
- Wedges module showing a breakdown of the levers enabling to reduce emissions between two scenarios.
- Granular Energy Demand Forecast diving into end uses consumption.
Energies and Emissions:
- Oil,
- Gas,
- Coal,
- Electricity,
- Bioenergies,
- Hydrogen,
- Heat,
- Renewables,
- CO2 emissions
- CCS: CO2 captures per source (fossils, process, biomass, DACCS)
Power:
- Electricity generation and capacity by energy type:
- fossil fuels, (oil, gas, coal),
- nuclear,
- hydro,
- offshore and onshore wind,
- centralised and distributed PV for solar,
- bioenergy (solid biomass, biofuels, biomethane) & other renewables
Demand:
- Total primary and final demand by fuel,
- Final demand by sector and fuel
Sectors:
- Power production,
- Industry,
- Transport,
- Buildings (which includes residential, services and agriculture)
Hydrogen:
- Consumption by final demand sector
- Production by source (fossil, fossil + CCS, electrolysis, bioenergy)
- End-user price projections in industry
Data Centres:
- Historical and projections of their energy consumption and capacity
- Available for 30+ countries and aggregates
- Quarterly Updated Accurate Data: Stay informed with the most up-to-date information
- Inflation Adjustments: Our prices include adjustments for inflation
- POLES Forecasting Model: Leverage the robust POLES model for a comprehensive 360-degree view of global markets
- Global Insights: Access the latest insights from 73 countries and regions across three different Enerfuture scenarios
- Evolution Analysis: Watch the trends of international oil, gas and coal prices
Geographical Coverage
65+ countries and aggregates
EUROPE
Austria
Belgium
Bulgaria
Croatia
Czechia
Denmark
Finland
France
Germany
Greece
Hungary
Ireland
Italy
Netherlands
Norway
Poland
Portugal
Romania
Slovakia
Slovenia
Spain
Sweden
Switzerland
Türkiye (Turkey)
United Kingdom
Europe aggregates*:
Europe
European Union
Baltic States (Estonia, Latvia and Lithuania)
AMERICAS
Canada
United States
Mexico
Brazil
Argentina
Chile
Americas aggregates*:
North America
Latin America
Central America, Mexico and the Caribbean
Central America and the Caribbean
South America excluding Brazil, Argentina, and Chile (includes Colombia, Venezuela, Ecuador, Peru, Bolivia, Suriname, Guyana, Paraguay, Uruguay)
ASIA
India
China
Indonesia
Japan
South Korea
Malaysia
Thailand
Vietnam
Asia aggregates*:
Asia
South Asia (excluding India)
Rest of Southeast Asia
PACIFIC
Australia
Pacific (aggregate)*
CIS
Russia
Ukraine
CIS aggregates*:
CIS
Other CIS (Armenia, Azerbaijan, Belarus, Georgia, Kazakhstan, Kyrgyzstan, Moldova, Tajikistan, Turkmenistan, Uzbekistan)
AFRICA
Algeria-Libya*
Egypt
Morocco-Tunisia*
South Africa
Africa aggregates*:
Africa
Northern Africa
Sub-Saharan Africa (excluding South Africa)
MIDDLE EAST
Saudi Arabia
Middle East aggregates*:
Middle-East
Gulf Countries
Mediterranean (excl. Gulf countries)
Data Centres
Country-level modelling including electricity demand, cost-based competition for supply, breakdown by type and end-use.
|
Value proposition:
Features:
|
 |
EnerFuture Scenarios
 EnerBase
EnerBase describes a world in which existing policies and historical trends are continued without any further climate ambition. The latest updates are more ambitious on GHG emission mitigation as it forecasts a decrease after 2035. This scenario leads to a temperature rise around 3°C.
 EnerBlue
EnerBlue is based on the successful achievement of NDCs (Nationally Determined Contributions) and other national pledges for 2030, as well as a continuation of consistent efforts post 2030. Sustained growth in emerging countries is a powerful driver of global energy demand, but policies play a key role in controlling the pace of growth. This scenario leads to a global temperature rise between 2.0°C and 2.5°C.
 EnerGreen
EnerGreen explores the implications of more stringent climate policies, with countries fulfilling or overachieving their NDC commitments and then regularly revising their emissions goals. These changes lead to significant improvements in energy efficiency and a strong deployment of renewables. In this cleaner trajectory, global temperature increase is limited to well below 2 °C.
Related Information
Global Energy & Climate Scenarios Through 2050
Our modelling experts just released the 2026 edition of our in-depth look at the future of energy. This analysis leverages the last update o...
