Spain Key Figures
- Population:
- 48.8 million
- GDP growth rate:
- 3.15 %/year
- Energy independence:
- 32.9%
Data of the last year available: 2024
- Total consumption/GDP:*
- 80.1 (2015=100)
- CO2 Emissions:
- 4.13 tCO2/cap
- Rate of T&D power losses:
- 9.64%
* at purchasing power parity
View all macro and energy indicators in the Spain energy report
Spain Energy News
View all news, archive your new and create your own daily newsletters only on your topics/countries of interest with Key Energy Intelligence
Spain Energy Research
- Spain's Energy & Climate Policy Framework: Spain aims for 48% renewables in energy consumption by 2030 and carbon neutrality by 2050, phasing out coal by 2026. The NECP 2024 outlines targets for energy efficiency, renewables, and GHG reductions. EUR 65bn is allocated for ecological transition under the NRRP, focusing on renewables, storage, and hydrogen. The electricity market is liberalised, with regulated tariffs for vulnerable consumers. Spain is expanding energy storage and promoting green hydrogen, with plans to close nuclear plants by 2035.
- Spain's Energy Companies: Spain's energy sector is dominated by Iberdrola, Endesa, and Naturgy, which together account for half of the country's power generation. Iberdrola leads in renewable energy, while Naturgy is the top gas supplier. Repsol and Cepsa dominate the oil market. Key players in transmission and distribution include Redeia and Nedgia. The sector is undergoing significant investment in renewables and decarbonisation.
- Spain's Energy Supply & Demand: In 2024, Spain's energy mix saw a 75% share of CO2-free generation, with oil dominating at 44%. Total energy consumption rose slightly to 112 Mtoe, while per capita use remained 17% below the EU average. Renewables accounted for 58% of electricity production, and CO2 intensity of electricity generation fell by 55% since 2010. Spain also became a net exporter of electricity.
- Spain's Energy Use & Price by Sector: In 2024, Spain's final energy demand rose by 3% to 83.5 Mtoe, with oil dominating (51%) but declining since 2010. Transport was the largest consumer (39%), followed by households and services (32%). Electricity's share remained stable at 23%, though it must increase to 62% by 2050 to meet climate goals. Industrial energy use fell slightly, with gas becoming more prominent. Transport and residential sectors saw price fluctuations, with government interventions to mitigate impacts.
- Spain's Issues & Prospects: Spain aims to significantly expand its renewable energy capacity, targeting 160 GW of renewables (76 GW solar, 62 GW wind) by 2030, with 81% of electricity generation from renewables. The country is also advancing hydrogen projects, energy storage, and grid infrastructure to support this transition.
Benefit from up to 2 000 up-to-date data series for 186 countries in Global Energy & CO2 data
A data overview is available in the global energy statistics app
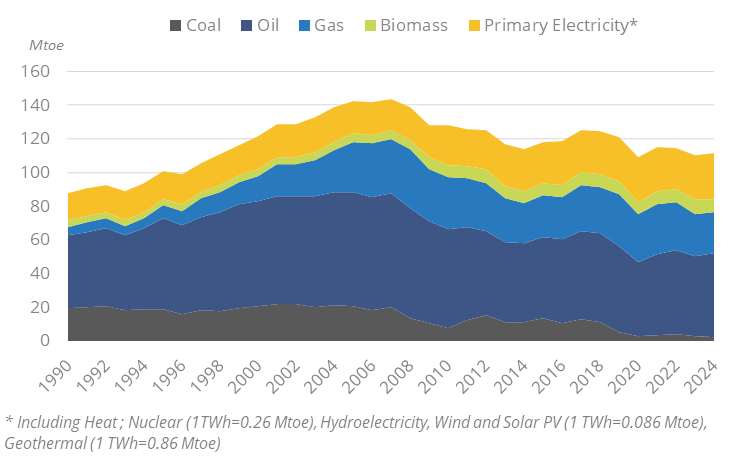
Spain Total Energy Production & Consumption
Total energy consumption increased by around 1% in 2024 to 112 Mtoe, after declining by 2%/year on average from 2017 to 2023. Total energy consumption per capita reached 2.3 toe in 2024, which is about 17% lower than the EU average.
Graph: Primary Consumption Trends by Energy Source
Source: Spain energy report
Interactive Chart Spain Total Energy Production & Consumption
Source: Global Energy & CO2 data
Benefit from up to 2 000 up-to-date data series for 186 countries in Global Energy & CO2 data
View the detailed fondamentals of the market at country level (graphs, tables, analysis) in the Spain energy report
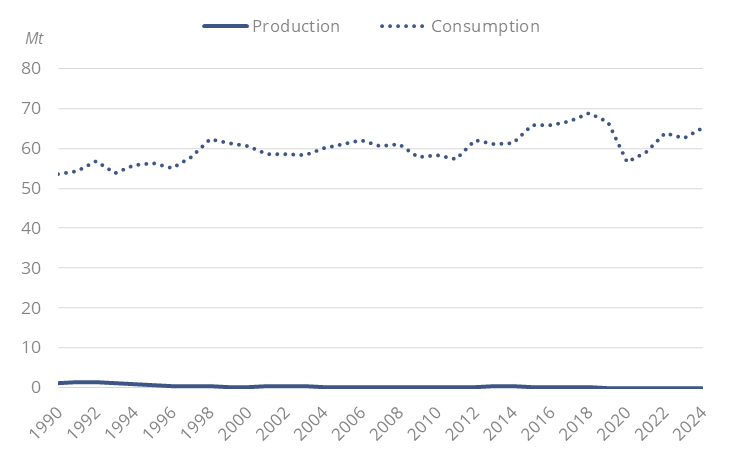
Spain Oil Production & Consumption
Crude oil and NGL production is negligible. Crude oil imports increased slightly by 3% in 2024, reaching 63.4 Mt, returning to its historical growth from 2010 to 2018. The main suppliers of crude in 2024 were the United States (16%), Brazil (14%), Mexico (13%), and Nigeria (11%).
Crude oil and NGL consumption reached 65 Mt in 2024 (+0.96%/year on average for2010-24).
Graph: Crude Oil Production & Consumption
Source: Spain energy report
Interactive Chart Spain Crude Oil Production & Consumption
Source: Global Energy & CO2 data
Interactive Chart Spain Refined Oil Products Production & Consumption
Source: Global Energy & CO2 data
Benefit from up to 2 000 up-to-date data series for 186 countries in Global Energy & CO2 data
Additionally, for more detailed information on refineries, you can request a sample of our EMEA Refineries Dataset
Spain Natural Gas Production & Consumption
The country's gas production is very limited (around 50 mcm in 2024).
The country's gas network is growing steadily and, in 2022, reached 94 785 km (compared to 37 000 km in 2000), including 13 361 km of primary and secondary transmission pipelines. The number of clients has increased from 4.2 m in 2000 to 8 m in 2025 with over 1 800 cities connected to the gas network.
Gas imports fell by 14% in 2024 to 30 bcm, 60% of which as LNG (-26% for LNG and +12% for piped gas); they mainly came from Algeria (39%), the United States (17%), Russia (21%), and Nigeria (14%).
Source: Spain energy report
Interactive Chart Spain Gas Production & Consumption
Source: Global Energy & CO2 data
Benefit from up to 2 000 up-to-date data series for 186 countries in Global Energy & CO2 data
Additionally, for more detailed information on the LNG trade, you can request a sample of our EMEA LNG Trade Dataset
Spain Coal and Lignite Production & Consumption
Spain stopped producing bituminous and brown coal in 2019. After a peak of 40 Mt between 1982 and 1985, production fell by about -15%/year between 2000 and 2016 to around 2 Mt.
Coal imports decreased by 62% in 2024 to 4 Mt (-16.5%/year over 2010-24), while consumption has also seen a steady decrease since 2010, reaching almost 4 Mt in 2024(-5%/year). The power sector represents the largest coal and lignite user, with almost 38%in 2024 (-39 pp since 2010), followed by industry (16%) and the residential and services sector (3%).
Graph: Coal Production & Consumption
Source: Spain energy report
Interactive Chart Spain Coal and Lignite Production & Consumption
Source: Global Energy & CO2 data
Benefit from up to 2 000 up-to-date data series for 186 countries in Global Energy & CO2 data
View the detailed consumption trends at country level (graphs, tables, analysis) in the Spain energy report
Spain Renewable in % Electricity Production
Under the NECP 2023-2030, Spain will increase the share of renewables to 48% of final energy consumption, of which 81% is for power (up from 74%) and 28% for transport (up from 25%). In 2023, renewables covered 25% of the final consumption (56.9% for electricity, 21.5% for heating and cooling, and 12% in transport).
Source: Spain energy report
Interactive Chart Spain Share of Renewables in Electricity Production (incl hydro)
Source: Global Energy & CO2 data
Benefit from up to 2 000 up-to-date data series for 186 countries in Global Energy & CO2 data
Learn more about renewables in the European Battery Market Analysis
Spain GHG emissions and CO2 emissions
According to the NECP 2023-2030, Spain aims to reduce its GHG gas emissions by 32% in 2030 compared to 1990 levels (70% emission reduction in ETS sectors and 43% in other sectors); in 2023, they were 13% below 1990 levels and 44% below 2005.
In 2021, the Parliament approved the Law on Climate Change and Energy Transition, which aims for carbon neutrality by 2050.
Source: Spain energy report
Interactive Chart Spain CO2 emissions
Source: Global Energy & CO2 data
Benefit from up to 2 000 up-to-date data series for 186 countries in Global Energy & CO2 data
View the detailed consumption trends at country level (graphs, tables, analysis) in the Spain energy report