South Africa Key Figures
- Population:
- 64.0 million
- GDP growth rate:
- 0.58 %/year
- Energy independence:
- 100%
Data of the last year available: 2024
- Total consumption/GDP:*
- 91.6 (2015=100)
- CO2 Emissions:
- 6.86 tCO2/cap
- Rate of T&D power losses:
- 11.1%
* at purchasing power parity
View all macro and energy indicators in the South Africa energy report
South Africa Energy News
View all news, archive your new and create your own daily newsletters only on your topics/countries of interest with Key Energy Intelligence
South Africa Energy Research
- South Africa's Energy & Climate Policy Framework: South Africa aims for net-zero energy by 2050, transitioning from coal to renewables, EVs, and green hydrogen, requiring significant investment. Key policies include the Just Transition Framework, IRP2025, and the Electricity Regulations Amendment Act, which promotes competition and renewable energy expansion. The country also focuses on energy efficiency, nuclear development, and climate change mitigation through carbon tax and emissions targets.
- South Africa's Energy Companies: Eskom generates 86% of South Africa's electricity, with plans to reach net-zero emissions by 2050. The National Transmission Company South Africa (NTCSA) began operating as an independent TSO in 2024. PetroSA and Sasol lead oil exploration, while coal production is dominated by Exxaro, Seriti, and Sasol. Green hydrogen production is also underway.
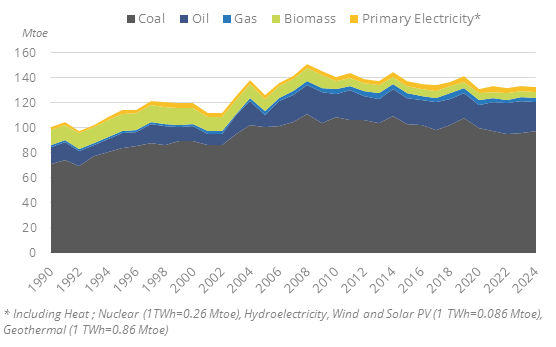
- South Africa's Energy Supply & Demand: In 2024, South Africa's energy mix remains dominated by coal (85%), despite a recent rebound in consumption. Total energy supply has stabilised at around 133 Mtoe, with coal and oil accounting for 74% and 17% of primary consumption, respectively. The country faces significant electricity challenges, with recent improvements in load-shedding. Renewable energy capacity has grown, but coal still dominates power generation. South Africa's energy sector is highly carbon-intensive, with emissions primarily driven by coal use. Efforts to reduce emissions and diversify the energy mix are ongoing, though progress remains slow.
- South Africa's Energy Use & Price by Sector: Since 2018, final energy consumption has declined by 2% annually, with oil dominating the energy mix. Electricity prices have surged by over 42% since 2020, driven by rising costs and regulatory adjustments. Industry, transport, and households are the primary energy consumers, with electricity playing a significant role across sectors.
- South Africa's Issues & Prospects: South Africa plans to expand its energy capacity, focusing on renewables (59 GW) and gas (16 GW) by 2039. The Just Energy Transition Investment Plan (JET IP) requires ZAR1.48 trillion (USUSD 83bn) to cut carbon emissions, supported by international funding. Key projects include nuclear, gas, and renewable energy developments, with significant investments in transmission and storage infrastructure. The country also aims to develop green hydrogen and reduce coal dependency.
Benefit from up to 2 000 up-to-date data series for 186 countries in Global Energy & CO2 data
A data overview is available in the global energy statistics app
South Africa Total Energy Production & Consumption
Total energy supply has remained relatively stable since 2020 at around 133 Mtoe. This follows a period of around 1% per year decline since a peak of 151 Mtoe in 2008. Total primary consumption per capita reached 2.1 toe in 2024.
Graph: Primary Consumption Trends by Energy Source
Source: South Africa energy report
Interactive Chart South Africa Total Energy Production & Consumption
Source: Global Energy & CO2 data
Benefit from up to 2 000 up-to-date data series for 186 countries in Global Energy & CO2 data
View the detailed fondamentals of the market at country level (graphs, tables, analysis) in the South Africa energy report
South Africa Oil Production & Consumption
Conventional production of crude oil is marginal (0.03 Mt in 2024). Oil mostly comes from synthetic fuels through the Secunda coal-to-liquid facility (Sasol, 150 kb/d), which produced 3.3 Mt of refined products in FY2023-2024. Another plant, Mossel Bay GTL (PetroSA, 45 kb/d), is off since 2020 due to a lack of gaseous feedstock.
Source: South Africa energy report
Interactive Chart South Africa Crude Oil Production & Consumption
Source: Global Energy & CO2 data
Interactive Chart South Africa Refined Oil Products Production & Consumption
Source: Global Energy & CO2 data
Benefit from up to 2 000 up-to-date data series for 186 countries in Global Energy & CO2 data
Additionally, for more detailed information on refineries, you can request a sample of our EMEA Refineries Dataset
South Africa Natural Gas Production & Consumption
Natural gas production is marginal (less than 1 bcm since 2021). The offshore gas reserves located in Mossel Bay (Bredasdorp Basin) were put into production in 2007 in order to supply the GTL plant of Mossel Bay (plant commissioned in 1992 as the world's first GTL refinery) but are now insufficient for the plant.
Source: South Africa energy report
Interactive Chart South Africa Gas Production & Consumption
Source: Global Energy & CO2 data
Benefit from up to 2 000 up-to-date data series for 186 countries in Global Energy & CO2 data
Additionally, for more detailed information on the LNG trade, you can request a sample of our EMEA LNG Trade Dataset
South Africa Coal and Lignite Production & Consumption
Coal production remained largely stable in 2024 (233 Mt) and was 9% lower than the 2019 peak.
South Africa is the world's 6th largest exporter (7th largest producer) with 63 Mt of exports in 2024. Almost all the exports take place from the Richard Bay Coal Terminal (RBCT), with some minor volumes shipped through Durban or Maputo (Mozambique). Coal mining is mainly carried out at 11 mines accounting for around 70% of the output. More than 80% of the coal produced is mined in the Mpumalanga province.
Source: South Africa energy report
Interactive Chart South Africa Coal and Lignite Production & Consumption
Source: Global Energy & CO2 data
Benefit from up to 2 000 up-to-date data series for 186 countries in Global Energy & CO2 data
View the detailed consumption trends at country level (graphs, tables, analysis) in the South Africa energy report
South Africa Power Production & Consumption
Electricity was a major concern for some years, as the country was facing frequent blackouts. In 2023, the supply gap (approximately 4-6 GW in FY2022-23) resulted in 332 days (6 838 hours) of load-shedding. The situation is improving, and load shedding has almost disappeared since April 2024. CSIR estimated that these power cuts cost up to ZAR560 bn (US$30 bn) in 2022.
Source: South Africa energy report
Interactive Chart South Africa Power Production & Consumption
Source: Global Energy & CO2 data
Benefit from up to 2 000 up-to-date data series for 186 countries in Global Energy & CO2 data
View the detailed consumption trends at country level (graphs, tables, analysis) in the South Africa energy report
South Africa Renewable in % Electricity Production
The IRP2025 targets the addition of 22 GW of wind and solar over 2025-2030, made up of 7.3 GW of wind, 10 GW of solar PV, and 4.5 GW of rooftop PV. Wind should account for 21% of installed capacity in 2030 and solar for 52% (including rooftop PV).
Source: South Africa energy report
Interactive Chart South Africa Share of Renewables in Electricity Production (incl hydro)
Source: Global Energy & CO2 data
Benefit from up to 2 000 up-to-date data series for 186 countries in Global Energy & CO2 data
South Africa GHG emissions and CO2 emissions
The Climate Change Act was adopted in 2024, with an objective to set out national climate change response to enable the country to meet its emissions reduction commitments. It includes mitigation and adaptation actions, emissions targets for each high-emitting sector, and allocation of carbon budgets to emitting companies.
Source: South Africa energy report
Interactive Chart South Africa CO2 emissions
Source: Global Energy & CO2 data
Benefit from up to 2 000 up-to-date data series for 186 countries in Global Energy & CO2 data
View the detailed consumption trends at country level (graphs, tables, analysis) in the South Africa energy report