South Africa Key Figures
- Population:
- 64.8 million
- GDP growth rate:
- 1.12 %/year
- Energy independence:
- 100%
Data of the last year available: 2025
- Total consumption/GDP:*
- 91.7 (2015=100)
- CO2 Emissions:
- 6.62 tCO2/cap
- Rate of T&D power losses:
- 11.5%
* at purchasing power parity
View all macro and energy indicators in the South Africa energy report
South Africa Energy News
View all news, archive your new and create your own daily newsletters only on your topics/countries of interest with Key Energy Intelligence
South Africa Energy Research
- South Africa's Energy & Climate Policy Framework: South Africa targets net zero by 2050, balancing grid stability with a coal phaseout. Key initiatives include expanding renewables, reforming electricity markets, and implementing carbon pricing.
- South Africa's Energy Companies: South Africa’s energy sector is undergoing significant structural reform, marked by Eskom’s unbundling, the emergence of new state entities, and a strategic pivot toward renewable energy and gas.
- South Africa's Energy Supply & Demand: South Africa remains coal-dependent but is expanding renewables, reducing load-shedding significantly. Energy supply is stable, yet high carbon intensity necessitates a long-term transition.
- South Africa's Energy Use & Price by Sector: In 2025, final energy consumption stabilised at 70 Mtoe, dominated by oil and coal. Electricity's share has fallen since 2010, while prices for industry and households have risen significantly since 2020.
- South Africa's Issues & Prospects: South Africa’s IRP2025 targets massive renewable and gas expansion to ensure energy security and decarbonisation. Despite funding gaps, major international investment and infrastructure projects progress.
Benefit from up to 2 000 up-to-date data series for 186 countries in Global Energy & CO2 data
A data overview is available in the global energy statistics app
South Africa Total Energy Production & Consumption
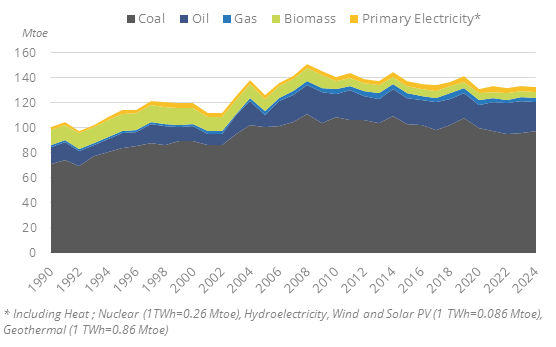
Total energy supply has remained relatively stable since 2023 at around 135 Mtoe. This follows a period of around 1% per year decline since a peak of 151 Mtoe in 2008. Total primary consumption per capita reached 2.1 toe in 2025.
Graph: Primary Consumption Trends by Energy Source
Source: South Africa energy report
Interactive Chart South Africa Total Energy Production & Consumption
Source: Global Energy & CO2 data
Benefit from up to 2 000 up-to-date data series for 186 countries in Global Energy & CO2 data
View the detailed fondamentals of the market at country level (graphs, tables, analysis) in the South Africa energy report
South Africa Oil Production & Consumption
Conventional production of crude oil is marginal (0.03 Mt in 2025). Oil mostly comes from synthetic fuels through the Secunda coal-to-liquid facility (Sasol, 150 kb/d), which produced 3.5 Mt of refined products in 2025. Another plant, Mossel Bay GTL (PetroSA, 45 kb/d), is off since 2020 due to a lack of gaseous feedstock.
Source: South Africa energy report
Interactive Chart South Africa Crude Oil Production & Consumption
Source: Global Energy & CO2 data
Interactive Chart South Africa Refined Oil Products Production & Consumption
Source: Global Energy & CO2 data
Benefit from up to 2 000 up-to-date data series for 186 countries in Global Energy & CO2 data
Additionally, for more detailed information on refineries, you can request a sample of our EMEA Refineries Dataset
South Africa Natural Gas Production & Consumption
Natural gas production is marginal (less than 1 bcm since 2021). The offshore gas reserves located in Mossel Bay (Bredasdorp Basin) were put into production in 2007 in order to supply the GTL plant of Mossel Bay (plant commissioned in 1992 as the world's first GTL refinery) but are now insufficient for the plant.
Source: South Africa energy report
Interactive Chart South Africa Gas Production & Consumption
Source: Global Energy & CO2 data
Benefit from up to 2 000 up-to-date data series for 186 countries in Global Energy & CO2 data
Additionally, for more detailed information on the LNG trade, you can request a sample of our EMEA LNG Trade Dataset
South Africa Coal and Lignite Production & Consumption
Coal production has remained stable since 2021, reaching 234 Mt in 2025. This follows a decline of 3%/year over 2018-2021. Overall, the 2025 coal production is 10% below its 2018 level.
Source: South Africa energy report
Interactive Chart South Africa Coal and Lignite Production & Consumption
Source: Global Energy & CO2 data
Benefit from up to 2 000 up-to-date data series for 186 countries in Global Energy & CO2 data
View the detailed consumption trends at country level (graphs, tables, analysis) in the South Africa energy report
South Africa Power Production & Consumption
Electricity was a major concern for some years, as the country was facing frequent blackouts. In 2023, the supply gap (approximately 4-6 GW in FY2022-23) resulted in 332 days (6 838 hours) of load-shedding. CSIR estimated that these power cuts cost up to ZAR560 bn (US$30 bn) in 2022. The situation is improving, and load shedding has almost disappeared since April 2024. Load shedding was reduced to 13 days in FY2025.
Source: South Africa energy report
Interactive Chart South Africa Power Production & Consumption
Source: Global Energy & CO2 data
Benefit from up to 2 000 up-to-date data series for 186 countries in Global Energy & CO2 data
View the detailed consumption trends at country level (graphs, tables, analysis) in the South Africa energy report
South Africa Renewable in % Electricity Production
The Integrated Resource Plan (IRP) from October 2025 targets the addition of 22 GW of wind and solar over 2025-2030, made up of 7.3 GW of wind, 10 GW of solar PV, and 4.5 GW of rooftop PV. Wind should account for 21% of installed capacity in 2030 and solar for 52% (including rooftop PV).
Source: South Africa energy report
Interactive Chart South Africa Share of Renewables in Electricity Production (incl hydro)
Source: Global Energy & CO2 data
Benefit from up to 2 000 up-to-date data series for 186 countries in Global Energy & CO2 data
South Africa GHG emissions and CO2 emissions
The Climate Change Act was adopted in 2024, with an objective to set out national climate change response to enable the country to meet its emissions reduction commitments. It includes mitigation and adaptation actions, emissions targets for each high-emitting sector, and allocation of carbon budgets to emitting companies.
Source: South Africa energy report
Interactive Chart South Africa CO2 emissions
Source: Global Energy & CO2 data
Benefit from up to 2 000 up-to-date data series for 186 countries in Global Energy & CO2 data
View the detailed consumption trends at country level (graphs, tables, analysis) in the South Africa energy report