Peru Key Figures
- Population:
- 34.2 million
- GDP growth rate:
- 3.30 %/year
- Energy independence:
- 89.9%
Data of the last year available: 2024
- Total consumption/GDP:*
- 107 (2015=100)
- CO2 Emissions:
- 1.72 tCO2/cap
- Rate of T&D power losses:
- 11.3%
* at purchasing power parity
View all macro and energy indicators in the Peru energy report
Peru Energy News
View all news, archive your new and create your own daily newsletters only on your topics/countries of interest with Key Energy Intelligence
Peru Energy Research
- Peru's Energy & Climate Policy Framework: Peru aims for 20% wind and solar in its power mix by 2030, alongside a 30% GHG reduction. The Ministry of Energy and Mines oversees the sector, with Osinergmin regulating energy and mining activities. The electricity market was liberalised in 1992, and free market customers have grown significantly. Peru is expanding rural electrification and promoting renewables, with a target of 60% renewables in the electricity mix by 2025. Recent laws aim to simplify renewable energy project approvals and enhance energy efficiency.
- Peru's Energy Companies: In Peru, Kallpa and Engie lead electricity generation, while China-owned Pluz Energía and Luz del Sur dominate distribution. ISA Peru manages most transmission lines. In oil, Petrotal and Petroperú are key players, with Petroperú facing financial challenges. Pluspetrol leads gas production, and COGA oversees transmission. Calidda dominates gas distribution in Lima.
- Peru's Energy Supply & Demand: Peru's energy mix is dominated by hydroelectricity (52%) and natural gas (40%), with rapid growth in consumption (7%/year since 2020). Oil leads primary energy use (44%), followed by gas (30%). Electricity capacity has doubled since 2010, with significant renewable additions. Gas production surged (7.5%/year since 2020), while oil production stabilised. GHG emissions rose, driven by fuel combustion and deforestation.
- Peru's Energy Use & Price by Sector: "Transport accounts for 44% of final energy consumption, with oil products dominating. Industry and households/services share the remainder. Energy demand has risen since 2021, with electricity and oil products leading supply."
- Peru's Issues & Prospects: Peru is advancing 67 GW of power projects, with hydro and solar leading. Key projects include San Gaban III (210 MW), Hanaqpampa (300 MW solar), and Quercus (452 MW wind). Green hydrogen initiatives are also gaining traction, with major solar-linked projects planned. Transmission and oil/gas exploration are also progressing, though challenges remain.
Benefit from up to 2 000 up-to-date data series for 186 countries in Global Energy & CO2 data
A data overview is available in the global energy statistics app
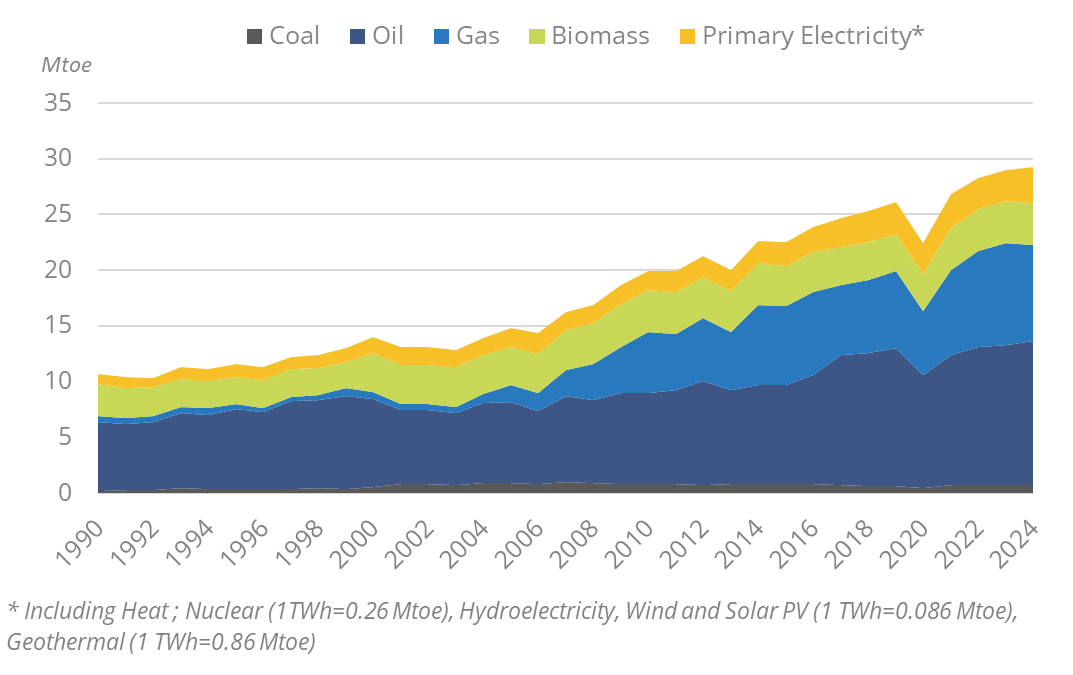
Peru Total Energy Production & Consumption
Total energy consumption has been increasing rapidly since 2020 (7%/year), reaching 29 Mtoe in 2024. Consumption per capita is low, at 0.8 toe in 2024, a level under surrounding countries (2.1 toe in Chile and 0.9 toe in Columbia). It increased by 3%/year between2010-2019.
Graph: Primary Consumption Trends by Energy Source
Source: Peru energy report
Interactive Chart Peru Total Energy Production & Consumption
Source: Global Energy & CO2 data
Benefit from up to 2 000 up-to-date data series for 186 countries in Global Energy & CO2 data
View the detailed fondamentals of the market at country level (graphs, tables, analysis) in the Peru energy report
Peru Oil Production & Consumption
Oil production has remained stable since 2021 (5 Mt in 2024), after a decrease of 12% in 2020. It grew by 5%/year between 2017 and 2019, after another drop of almost 30% between 2014 and 2016. Exports of crude oil are largely inexistant (0.9 Mt in 2024).
The Nor-Peruano pipeline (854 km), with a capacity of 200 kb/d and which transports oil from Saramuro (Loreto) to the port of Bayovar (Piura), began operations in 2017.
Source: Peru energy report
Interactive Chart Peru Crude Oil Production & Consumption
Source: Global Energy & CO2 data
Interactive Chart Peru Refined Oil Products Production & Consumption
Source: Global Energy & CO2 data
Benefit from up to 2 000 up-to-date data series for 186 countries in Global Energy & CO2 data
Additionally, for more detailed information on refineries, you can request a sample of our America Refineries Dataset
Peru Natural Gas Production & Consumption
Gas production has increased by 7.5%/ year since 2020, reaching 17.4 bcm in 2024. The last decade showed an average growth of 2%/year but was marked by a few ups and downs, with a peak at 15.5 bcm in 2016 followed by a 17% fall until 2020. The Camisea fields(Block 88-56-57) account for 95% of total gas production since 2011.
Around 60% of gas produced is consumed locally (10.5 bcm in 2024). Over half of gas consumption is used in power plants (56%), 17% in industry, and 9% in transport (2024).
Source: Peru energy report
Interactive Chart Peru Gas Production & Consumption
Source: Global Energy & CO2 data
Benefit from up to 2 000 up-to-date data series for 186 countries in Global Energy & CO2 data
Additionally, for more detailed information on the LNG trade, you can request a sample of our America LNG Trade Dataset
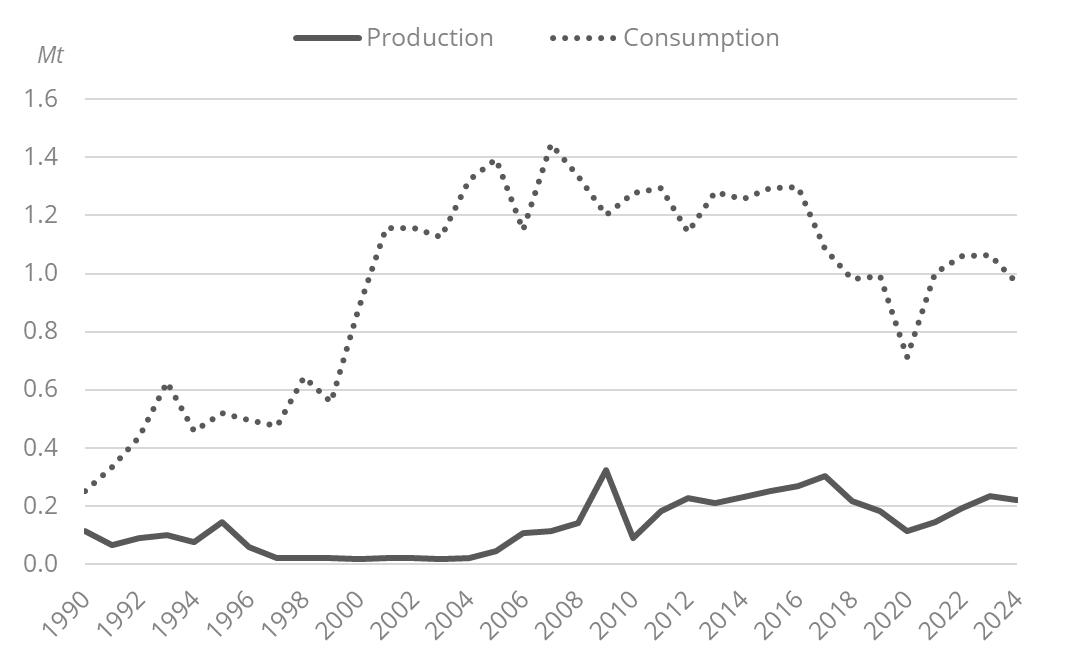
Peru Coal and Lignite Production & Consumption
Coal production is extremely low (0.2 Mt in 2024). Very little coal is consumed, the greatest share is for industrial uses (87% in 2024).
Graph: Coal Production & Consumption
Source: Peru energy report
Interactive Chart Peru Coal and Lignite Production & Consumption
Source: Global Energy & CO2 data
Benefit from up to 2 000 up-to-date data series for 186 countries in Global Energy & CO2 data
View the detailed consumption trends at country level (graphs, tables, analysis) in the Peru energy report
Peru Renewable in % Electricity Production
The National Energy Plan 2014-2025 set a target of 60% of renewables in the electricity mix in 2025 (54% hydropower and 6% from other renewables) (objective nearly met as it reached 59% in 2024) and a 20% share of wind and solar power by 2030 (8% in 2024).
Source: Peru energy report
Interactive Chart Peru Share of Renewables in Electricity Production (incl hydro)
Source: Global Energy & CO2 data
Benefit from up to 2 000 up-to-date data series for 186 countries in Global Energy & CO2 data
Peru GHG emissions and CO2 emissions
The last NDC (2025) kept the same GHG emissions reduction target as in its 2020 NDC, i.e.-30% in 2030 (to 209 MtCO2eq) compared to a BAU scenario. This target could be increased to 40% (179 MtCO2eq) with international support through bilateral, multilateral cooperation and implementation of mechanisms under the Paris Agreement.
Source: Peru energy report
Interactive Chart Peru CO2 emissions
Source: Global Energy & CO2 data
Benefit from up to 2 000 up-to-date data series for 186 countries in Global Energy & CO2 data
View the detailed consumption trends at country level (graphs, tables, analysis) in the Peru energy report