
- Update
- Format
- 3 files (PDF report, 2 Excel files)
- Pages
-
55 (Report only)
- Delivery
- Immediate by e-mail
- GENERAL OVERVIEW
- ENERGY AND CLIMATE POLICY FRAMEWORK
- ENERGY COMPANIES
- ENERGY SUPPLY AND DEMAND
- ENERGY USE AND PRICE BY SECTOR
- ISSUES AND PROSPECTS
- STATISTICS
- ABBREVIATIONS
- GLOSSARY
Buy Peru energy report
Price without VAT. Depending on your status and location, VAT might be applicable. Get in touch with us for more information.
After validation, you will immediately receive 3 files by email (one pdf report and 2 excel files containing the datasets).
Overview
Peru’s energy sector is advancing with ambitious climate and renewable targets, including a 30% reduction in emissions by 2030 and 20% wind and solar integration. Governed by the Ministry of Energy and Mines, the market features liberalised electricity, expanding rural electrification, and growing private investment in generation and transmission. Hydropower dominates, while solar and wind projects are accelerating, supported by regulatory reforms and international partnerships.
Get more details on the table of contents and data files, as well as the list of graphs and tables by browsing the tabs below.
Highlights
- For 2030, the country aims to reach a 30% share of wind and solar in the power mix and to reduce GHG emissions by 30% compared to a BAU scenario.
- Kallpa, Engie, Niagara Energy, and Electroperu are the main electricity producers, with around half of total electricity generation.
- Pluz Energía and Luz del Sur (both China-owned) cover 1/3 of power distribution.
- The power mix is dominated by hydroelectricity (52% on average), followed by natural gas (40%).
- Gas production has increased by 7.5%/year since 2020, around 60% of which is consumed locally, mostly in power plants.
- Transport accounts for 44% of final energy consumption and 76% of oil product consumption.
- While less than 2 GW of power projects are under construction, 67 GW are under development, including 30 GW hydro and 22 GW solar. Green hydrogen production projects are gaining momentum.
Energy & Climate Policy Framework
The Ministry of Energy and Mines (MINEM) is in charge of the energy sector, through three main Directorates: the General Directorate of Hydrocarbons (DGH), the General Directorate of Electricity (DGE), and the General Directorate of Mines (DGM).
Energy Companies
Gas:
Pluspetrol, a private company, carries out most of the gas production with Camisea's blocks 88 & 56 (79% of total production in 2024, followed by Repsol on block 57 (17%) and Olympic's XIII block (2%).
Energy Supply & Demand
Oil:
Oil production has remained stable since 2021 (5 Mt in 2024), after a decrease of 12% in 2020. It grew by 5%/year between 2017 and 2019, after another drop of almost 30% between 2014 and 2016. Exports of crude oil are largely inexistant (0.9 Mt in 2024).
Energy Use and Price by Sector
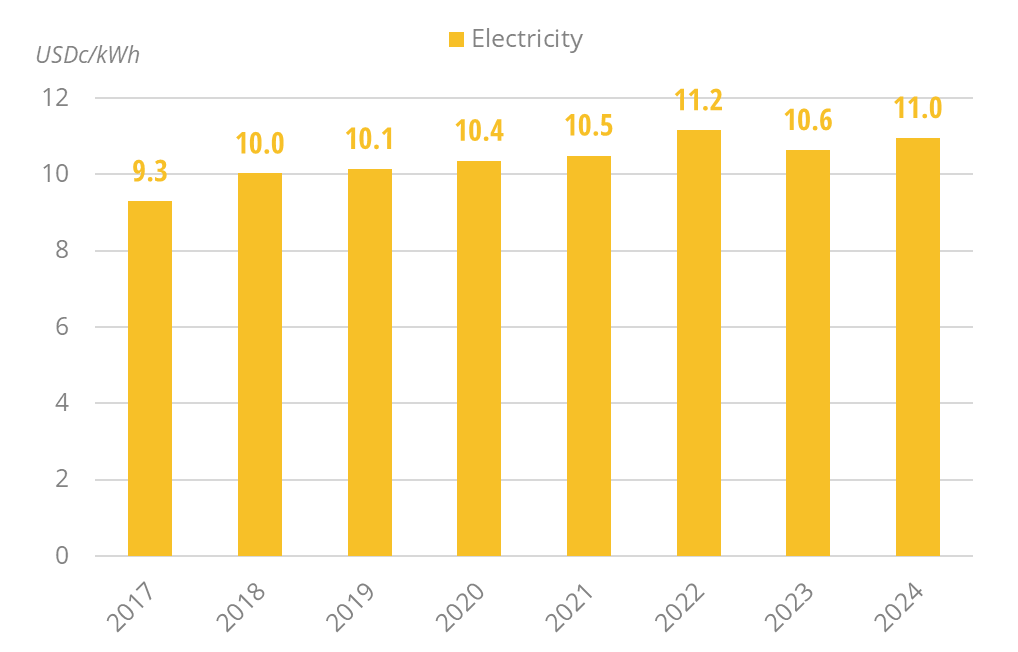
Energy Prices in Industry:
After decreasing by 5% in 2023, electricity prices for industry returned to their 2022 price at US$c11/kWh. From 2018-2021, prices were around US$c10/kWh.
Graph: Energy Prices in Industry (Taxes Included)
Issues & Prospects
Electricity:
Around 1.6 GW of power plants are under construction, with around 70% from solar and the remainder from hydropower plants. Around 67 GW are currently under development, including 43% from hydro, 33% from solar, and 21% from wind.
Graph: Upcoming New Capacity by Energy Source
- Graph 1: Primary Consumption Trends by Energy Source
- Graph 2: Total Consumption Market Share by Energy (2024)
- Graph 3: Installed Electric Capacity by Source
- Graph 4: Installed Electric Capacity by Source (2024)
- Graph 5: Gross Power Production by Source & Consumption
- Graph 6: Power Generation by Source (2024)
- Graph 7: Crude Oil Production & Consumption
- Graph 8: Petroleum Products Production & Consumption
- Graph 9: Gas Production & Consumption
- Graph 10: Coal Production & Consumption
- Graph 11: Emissions of GHG and CO2 from Fuel Combustion
- Graph 12: Final Demand Trends by Energy Source
- Graph 13: Final Consumption by Sector
- Graph 14: Final Consumption Market Share by Sector (2024)
- Graph 15: Final Consumption in Industry by Energy Source
- Graph 16: Energy Prices in Industry (Taxes Included)
- Graph 17: Final Consumption in Transport by Energy Source
- Graph 18: Energy Prices in Transport (Taxes Included)
- Graph 19: Final Consumption in Residential, Services, Agriculture by Energy Source
- Graph 20: Energy Prices in Residential (Taxes Included)
- Graph 21: Upcoming New Capacity by Energy Source
- Economic Indicators: Annual historical data including population, GDP growth, imports and exports, inflation rate, energy security and efficiency indicators, CO2 emissions.
- Supply Indicators: Historical data including oil and gas reserves, electric and refining capacity, energy production, power production and external trade. All are detailed by energy source.
- Demand Indicators: Historical data including consumption per inhabitant, consumption trends, total consumption by energy source, final consumption by energy source and sector, and electricity consumption by sector.
- Energy Balances: Single table displaying the overall energy industry balance per annum, also graphically displayed by energy sub-segment.
The Peru energy market data since 1990 and up to
is included in the Excel file accompanying the Peru country report.
It showcases the historical evolution, allowing users to easily work with the data.
Key Data included in the excelsheet:
- Economic indicators: Annual historical economic indicators, energy security, energy efficiency and CO2 emissions.
- Supply indicators: Annual historical reserves, capacity, production and external trade (imports(+) exports(-) balance).
- Demand indicators: Annual historical consumption per capita, consumption trends, total consumption, final consumption (per energy and per sector) and electricity consumption total and per sector.
- Energy Balance: total and per energy.
- Peru Energy Prices: In addition to the analysis provided on the report we also provided a data set which includes historical details on the Peru energy prices for the follow items: price of premium gasoline (taxes incl.), price of diesel (taxes incl.), price of electricity in industry (taxes incl.), price of electricity for households (taxes incl.), price of natural gas in industry (taxes incl.), prices of natural gas for households (taxes incl.), spot price of Brent and CO2 emissions (from fuel combustion).