Pakistan Key Figures
- Population:
- 251 million
- GDP growth rate:
- 3.23 %/year
- Energy independence:
- 63.3%
Data of the last year available: 2024
- Total consumption/GDP:*
- 87.9 (2015=100)
- CO2 Emissions:
- 0.66 tCO2/cap
- Rate of T&D power losses:
- 15.0%
* at purchasing power parity
View all macro and energy indicators in the Pakistan energy report
Pakistan Energy News
View all news, archive your new and create your own daily newsletters only on your topics/countries of interest with Key Energy Intelligence
Pakistan Energy Research
- Pakistan's Energy & Climate Policy Framework: Pakistan aims for 62% renewable energy in its power mix by 2035 and a 50% GHG emissions cut. The government oversees energy through the Petroleum and Power Divisions, promoting privatisation and shifting from gas to coal due to global energy shifts. Regulatory bodies like NEPRA and OGRA oversee electricity and oil/gas sectors, respectively. Despite challenges, Pakistan is advancing renewable energy policies and energy efficiency measures to meet climate goals.
- Pakistan's Energy Companies: "State-owned firms dominate Pakistan's electricity sector, with WAPDA hydro leading generation. Privatisation of public oil and gas companies is planned. Key players include K-Electric, IPPs, and PAEC. Transmission and distribution are managed by NTDC and regional DISCOs. Upstream oil and gas are led by OGDCL and PPL, with privatisation planned. Downstream includes PARCO and PSO. Gas supply involves PPL, UEG, and LNG terminals. Coal production is led by SECMC."
- Pakistan's Energy Supply & Demand: "Energy consumption and CO2 emissions in Pakistan have decreased by 14% since 2021, with hydroelectricity dominating the power mix. Fossil fuels account for nearly 70% of the energy supply, while biomass and primary electricity contribute 21% and 11%, respectively. The country has significant hydroelectric and natural gas resources, with substantial investments in renewable energy sources like wind and solar."
- Pakistan's Energy Use & Price by Sector: In 2024, final energy consumption remained stable at 75 Mtoe, with transport sector demand rising by 7%. Biomass accounted for one-fifth of total consumption, while oil's share increased to 29%. Households and services consumed over a third of energy, with industry and transport following. Electricity prices surged, particularly in industry, reaching nearly USUSD 19/kWh in 2023.
- Pakistan's Issues & Prospects: Pakistan is expanding its energy infrastructure, with over 20 GW of projects under construction, including 16 GW of hydro. China's CPEC initiative supports this growth, aiming to address power shortages and boost trade. The Integrated Generation Capacity Expansion Plan (IGCEP) targets 57 GW by 2035, with significant investments in renewables. Key projects include hydro, nuclear, coal, solar, and wind, alongside transmission upgrades and cross-border interconnections. Additionally, Pakistan is exploring oil and gas developments, LNG imports, and green hydrogen initiatives.
Benefit from up to 2 000 up-to-date data series for 186 countries in Global Energy & CO2 data
A data overview is available in the global energy statistics app
Pakistan Total Energy Production & Consumption
The country's total consumption increased slightly in 2024 (+1%) to 91 Mtoe, after decreasing by 8%/year from 2021 to 2023. It increased rapidly between 2015 and 2021 (6%/year) to a peak at 106 Mtoe, after remaining stable from 2006 to 2014. Per capita consumption is about 0.4 toe. Fossil fuels account for nearly 70% of the total energy mix, with gas accounting for 29% and in regression (-8 pp since 2010), oil for 27%, and coal for 12% (+8 pp). Biomass accounts for 21% (-5 pp) and primary electricity for 11% in 2024 (+6 pp), of which 6.5% is nuclear (+ 5 pp) and 3.5% is hydro.
Source: Pakistan energy report
Interactive Chart Pakistan Total Energy Production & Consumption
Source: Global Energy & CO2 data
Benefit from up to 2 000 up-to-date data series for 186 countries in Global Energy & CO2 data
View the detailed fondamentals of the market at country level (graphs, tables, analysis) in the Pakistan energy report
Pakistan Oil Production & Consumption
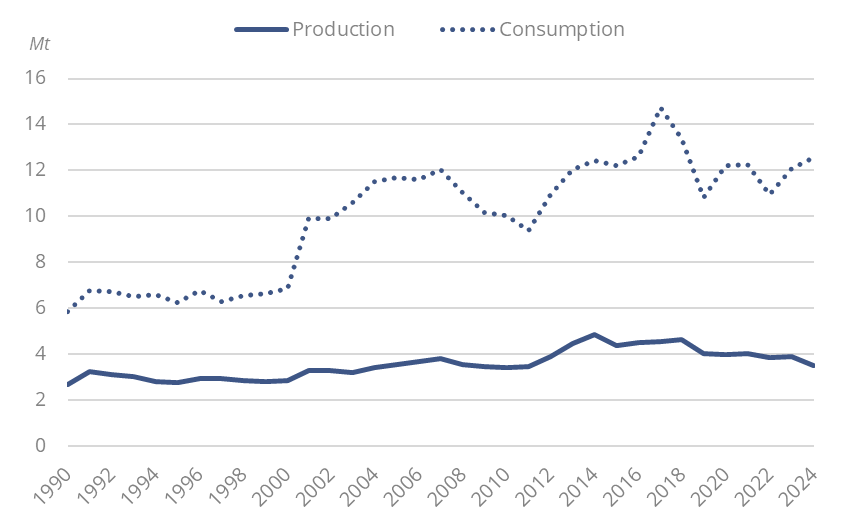
Crude oil production has fluctuated around 4 Mt since 2012 and dropped by 11% in 2024 (3.5 Mt). Production supplies around 28% of the country's needs. Crude oil imports increased by 10% in 2024 to 9 Mt.
Graph: Crude Oil Production & Consumption
Source: Pakistan energy report
Interactive Chart Pakistan Crude Oil Production & Consumption
Source: Global Energy & CO2 data
Interactive Chart Pakistan Refined Oil Products Production & Consumption
Source: Global Energy & CO2 data
Benefit from up to 2 000 up-to-date data series for 186 countries in Global Energy & CO2 data
Additionally, for more detailed information on refineries, you can request a sample of our Asia Refineries Dataset
Pakistan Natural Gas Production & Consumption
The country has two FSRU LNG terminals with a total capacity of 14 bcm/year, both located at Port Qasim, Karachi; one was commissioned in 2015 by EETPL (6.2 bcm/year), and the other is Pakistan GasPort (PGPCL) (7.8 bcm/year).
PSO signed a 15-year contract with Qatargas in 2016 for the supply of 5 bcm of LNG and a contract with Pertamina in 2018 for 2 bcm of LNG over 10 years (with an option for a 5-year extension). It signed a new 10-year agreement with Qatar Petroleum to import 3 Mt/year of LNG starting in 2022.
Source: Pakistan energy report
Interactive Chart Pakistan Gas Production & Consumption
Source: Global Energy & CO2 data
Benefit from up to 2 000 up-to-date data series for 186 countries in Global Energy & CO2 data
Additionally, for more detailed information on the LNG trade, you can request a sample of our Asia LNG Trade Dataset
Pakistan Coal and Lignite Production & Consumption
Graph: Coal Production & Consumption
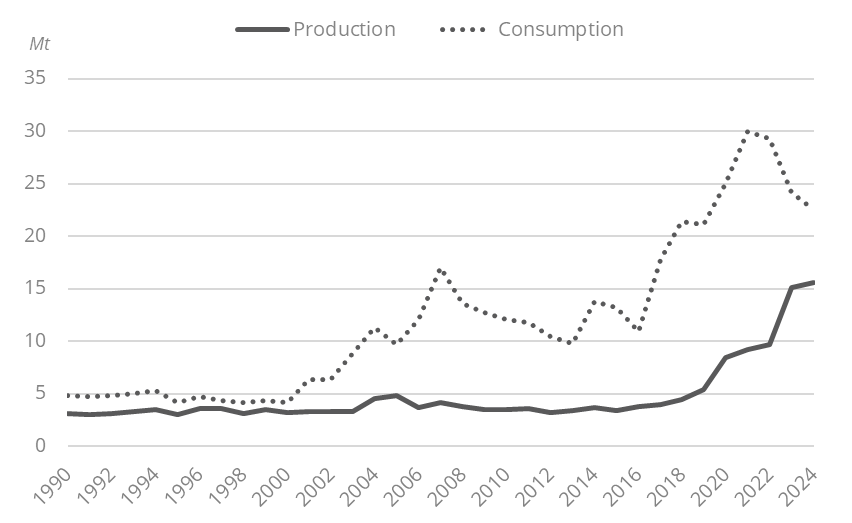
Coal and lignite production has increased by 18% per year on average since 2015 and reached about 15 Mt in 2024 (5 times more than in 2012). Coal imports quadrupled between 2015 and 2021, reaching around 21 Mt in 2021, in order to supply coal-fired power plants. However, tensions on international coal prices led to a significant drop in coal imports in 2023 and 2024, by around 65% to 7 Mt.
Source: Pakistan energy report
Interactive Chart Pakistan Coal and Lignite Production & Consumption
Source: Global Energy & CO2 data
Benefit from up to 2 000 up-to-date data series for 186 countries in Global Energy & CO2 data
View the detailed consumption trends at country level (graphs, tables, analysis) in the Pakistan energy report
Pakistan Renewable in % Electricity Production
AEDB, Alternative Energy Development Board, is the national agency for the promotion of renewables.
In its last NDC (2025), the country plans for capacities of renewables (including hydropower) to reach 38.5 GW in 2035 or 62% of the capacity mix.
Source: Pakistan energy report
Interactive Chart Pakistan Share of Renewables in Electricity Production (incl hydro)
Source: Global Energy & CO2 data
Benefit from up to 2 000 up-to-date data series for 186 countries in Global Energy & CO2 data
Learn more about renewables in the Mini grid Africa & Asia markets for village electrification
Pakistan GHG emissions and CO2 emissions
In its updated NDC (2025), Pakistan committed to cut its GHG emissions by up to 50% in 2035 relative to a BAU scenario (corresponding to limiting GHG emissions to 1 280 MtCO2eq). Of this reduction, 17% is unconditional (corresponding to 435 MtCO2eq) and the remaining 33% is conditional (corresponding to 844 MtCO2eq), depending on international support.
Source: Pakistan energy report
Interactive Chart Pakistan CO2 emissions
Source: Global Energy & CO2 data
Benefit from up to 2 000 up-to-date data series for 186 countries in Global Energy & CO2 data
View the detailed consumption trends at country level (graphs, tables, analysis) in the Pakistan energy report