
- Update
- Format
- 3 files (PDF report, 2 Excel files)
- Pages
-
58 (Report only)
- Delivery
- Immediate by e-mail
- GENERAL OVERVIEW
- ENERGY AND CLIMATE POLICY FRAMEWORK
- ENERGY COMPANIES
- ENERGY SUPPLY AND DEMAND
- ENERGY USE AND PRICE BY SECTOR
- ISSUES AND PROSPECTS
- STATISTICS
- ABBREVIATIONS
- GLOSSARY
Buy Pakistan energy report
Price without VAT. Depending on your status and location, VAT might be applicable. Get in touch with us for more information.
After validation, you will immediately receive 3 files by email (one pdf report and 2 excel files containing the datasets).
Overview
Pakistan’s energy strategy balances ambitious renewable targets—aiming for a dominant share in its power mix by 2035—with ongoing reliance on fossil fuels, particularly coal, amid shifting priorities post-Ukraine conflict. Governed by divided oversight between petroleum and power divisions, the sector faces privatisation drives, regulatory reforms, and persistent challenges like circular debt, while expanding hydropower and nuclear capacity to enhance energy security.
Get more details on the table of contents and data files, as well as the list of graphs and tables by browsing the tabs below.
Highlights
- Pakistan targets a share of 62% of renewables in the power capacity mix in 2035 and a 50% cut in GHG emissions compared to BAU.
- State-owned companies dominate the electricity sector with around 80% of the total capacity.
- The public oil and gas E&P companies are planned to be privatised.
- Total energy consumption and CO2 emissions from fuel combustion have decreased by 14% since 2021.
- The power mix is dominated by hydroelectricity.
- Total final consumption remained stable in 2024 but rose by 7% in the transport sector. Biomass supplies one fifth of total energy consumption, with a stable share since 2010.
- Households and services absorb around half of the final consumption.
- Over 20 GW of power projects are under construction in 2024 (of which 16 GW are hydro).
Energy & Climate Policy Framework
The Ministry of Energy oversees the energy sector through two divisions: the Petroleum Division, in charge of oil and gas supply, as well as of energy and mineral resources, and the Power Division.
Energy Companies
Electricity:
WAPDA hydro, a public utility, is the largest power generator (capacity of 9.5 GW), with 3 large dams: Tarbela (about 4.9 GW), Ghazi Barotha (1.45 GW), and Mangla (1 GW). The company is in charge of water and power development.
Energy Supply & Demand
Oil:
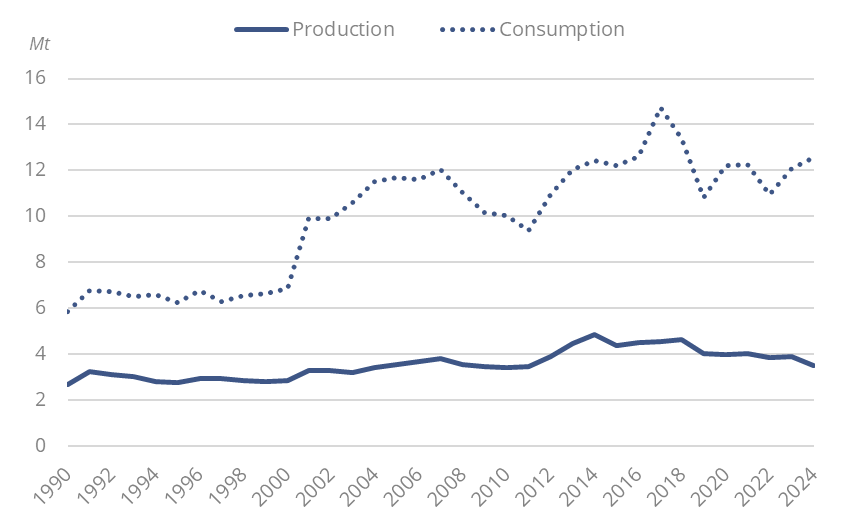
Crude oil production has fluctuated around 4 Mt since 2012 and dropped by 11% in 2024 (3.5 Mt). Production supplies around 28% of the country's needs. Crude oil imports increased by 10% in 2024 to 9 Mt.
Graph: Crude Oil Production & Consumption
Energy Use and Price by Sector
Energy Prices in Transport:
Gasoline and diesel prices follow international oil prices. Hence, after a significant increasein 2022, they returned to 2021 prices in 2023 and were stable in 2024, remaining at around 40% above 2020 prices and reaching US$0.93/l and US$0.94/l, respectively. Historically lower, gasoline caught up with diesel in 2021.
Issues & Prospects
As part of the China-Pakistan Economic Corridor (CPEC) initiative, China has pledged more than US$50bn in financial support to improve Pakistan's transport and energy infrastructure in order to end its ongoing power shortage crisis and boost trade from China's landlocked north-west region to Pakistan's Gwadar Port.
- Graph 1: Primary Consumption Trends by Energy Source
- Graph 2: Total Consumption Market Share by Energy (2024)
- Graph 3: Installed Electric Capacity by Source
- Graph 4: Installed Electric Capacity by Source (2024)
- Graph 5: Gross Power Production by Source & Consumption
- Graph 6: Power Generation by Source (2024)
- Graph 7: Crude Oil Production & Consumption
- Graph 8: Petroleum Products Production & Consumption
- Graph 9: Gas Production & Consumption
- Graph 10: Coal Production & Consumption
- Graph 11: Emissions of GHG and CO2 from Fuel Combustion
- Graph 12: Final Demand Trends by Energy Source
- Graph 13: Final Consumption by Sector
- Graph 14: Final Consumption Market Share by Sector (2024)
- Graph 15: Final Consumption in Industry by Energy Source
- Graph 16: Energy Prices in Industry (Taxes Included)
- Graph 17: Final Consumption in Transport by Energy Source
- Graph 18: Energy Prices in Transport (Taxes Included)
- Graph 19: Final Consumption in Residential, Services, Agriculture by Energy Source
- Graph 20: Energy Prices in Residential (Taxes Included)
- Graph 21: Upcoming New Capacity by Energy Source
- Economic Indicators: Annual historical data including population, GDP growth, imports and exports, inflation rate, energy security and efficiency indicators, CO2 emissions.
- Supply Indicators: Historical data including oil and gas reserves, electric and refining capacity, energy production, power production and external trade. All are detailed by energy source.
- Demand Indicators: Historical data including consumption per inhabitant, consumption trends, total consumption by energy source, final consumption by energy source and sector, and electricity consumption by sector.
- Energy Balances: Single table displaying the overall energy industry balance per annum, also graphically displayed by energy sub-segment.
The Pakistan energy market data since 1990 and up to
is included in the Excel file accompanying the Pakistan country report.
It showcases the historical evolution, allowing users to easily work with the data.
Key Data included in the excelsheet:
- Economic indicators: Annual historical economic indicators, energy security, energy efficiency and CO2 emissions.
- Supply indicators: Annual historical reserves, capacity, production and external trade (imports(+) exports(-) balance).
- Demand indicators: Annual historical consumption per capita, consumption trends, total consumption, final consumption (per energy and per sector) and electricity consumption total and per sector.
- Energy Balance: total and per energy.
- Pakistan Energy Prices: In addition to the analysis provided on the report we also provided a data set which includes historical details on the Pakistan energy prices for the follow items: price of premium gasoline (taxes incl.), price of diesel (taxes incl.), price of electricity in industry (taxes incl.), price of electricity for households (taxes incl.), price of natural gas in industry (taxes incl.), prices of natural gas for households (taxes incl.), spot price of Brent and CO2 emissions (from fuel combustion).