Nigeria Key Figures
- Population:
- 233 million
- GDP growth rate:
- 3.43 %/year
- Energy independence:
- 100%
Data of the last year available: 2024
- Total consumption/GDP:*
- 92.1 (2015=100)
- CO2 Emissions:
- 0.41 tCO2/cap
- Rate of T&D power losses:
- 16.2%
* at purchasing power parity
View all macro and energy indicators in the Nigeria energy report
Nigeria Energy News
View all news, archive your new and create your own daily newsletters only on your topics/countries of interest with Key Energy Intelligence
Nigeria Energy Research
- Nigeria's Energy & Climate Policy Framework: Nigeria aims for 30% renewables in its power mix by 2030, universal energy access, and a 35% GHG reduction by 2035. The Energy Transition Plan targets carbon neutrality by 2060, with gas as a transition fuel. Key policies include the Petroleum Industry Bill, National Gas Policy, and a new electricity act to attract private investment. The country also seeks to expand renewables, improve energy efficiency, and reduce gas flaring.
- Nigeria's Energy Companies: "Several Nigerian energy firms face insolvency and privatisation, including key players in oil, gas, and electricity. Major companies like Shell, TotalEnergies, and ExxonMobil dominate production, with some divesting assets. The electricity sector is led by state-owned and private firms, while distribution companies struggle with high losses and unmetered customers. The government plans to restructure and sell insolvent distribution firms."
- Nigeria's Energy Supply & Demand: Nigeria's energy supply has declined, with hydrocarbon output falling and biomass decreasing in the mix. Gas consumption is rising, while electricity capacity remains limited, with gas and hydro as primary sources. Oil production has rebounded, and refining capacity has increased, though exports dominate. Gas exports, mainly as LNG, have decreased. GHG emissions are stable, with energy combustion contributing significantly.
- Nigeria's Energy Use & Price by Sector: Final energy demand rose 20% from 2017-2024, with transport's share increasing to a third. Biomass led consumption, though declining, while petroleum products grew. Households and services remained the largest consumers, though their share fell. Industrial demand rebounded post-2019, with gas and coal use rising. Transport demand dropped sharply in 2023 due to price hikes, while electricity and fuel prices varied significantly across sectors.
- Nigeria's Issues & Prospects: Nigeria's energy sector requires USD 1 trillion over 30 years, with electricity demand set to grow 7% annually. By 2050, power capacity will reach 250 GW, dominated by solar and hydrogen. Oil production aims for 4.5 mb/d by 2030, with major projects by ExxonMobil, Shell, and Eni. Gas projects include NLNG Train 7 and the AKK pipeline, while refinery expansions are planned.
Benefit from up to 2 000 up-to-date data series for 186 countries in Global Energy & CO2 data
A data overview is available in the global energy statistics app
Nigeria Total Energy Production & Consumption
After reaching a peak at 73 Mtoe in 2021, total consumption has declined by 5%, reaching 69 Mtoe in 2024. Consumption per capita was 0.3 toe in 2024 (about a third lower than the average for Sub-Saharan Africa). The share of biomass in the energy mix is decreasing slowly, from 49% in 2010 to 40% in 2024 (compared to 50% on average for Sub-Saharan Africa). Oil is the second most important energy source with 33% (35% in 2010). The share of gas is increasing, from 15% in 2010 to 25% in 2025, as the government aims to increase gas consumption.
Source: Nigeria energy report
Interactive Chart Nigeria Total Energy Production & Consumption
Source: Global Energy & CO2 data
Benefit from up to 2 000 up-to-date data series for 186 countries in Global Energy & CO2 data
View the detailed fondamentals of the market at country level (graphs, tables, analysis) in the Nigeria energy report
Nigeria Oil Production & Consumption
After halving from a peak at 127 Mt in 2010 until 2022 (-6%/year), oil production rebounded by 6%/year to 68 Mt in 2024. In 2024, the country's output was about 9% lower than its OPEC quota. Nigeria was the largest African oil producer in 2024, surpassing Angola, Libya, and Algeria by around 20%.
The share of exported production declined from 95% in 2023 to 81% in 2024 as domestic production of refined products increased. In 2023, crude oil exports mainly went to the Netherlands (15%), India (10%), and Spain (10%).
Graph: Crude Oil Production & Consumption
Source: Nigeria energy report
Interactive Chart Nigeria Crude Oil Production & Consumption
Source: Global Energy & CO2 data
Interactive Chart Nigeria Refined Oil Products Production & Consumption
Source: Global Energy & CO2 data
Benefit from up to 2 000 up-to-date data series for 186 countries in Global Energy & CO2 data
Additionally, for more detailed information on refineries, you can request a sample of our EMEA Refineries Dataset
Nigeria Natural Gas Production & Consumption
After reaching a peak at 46 bcm in 2020, gas production declined by 5%/year until 2023 and rebounded by 5% in 2024. Nigeria was the second largest African gas producer in 2024, far behind Algeria (55% lower) and similar to Egypt. Previously, gas production multiplied by 6.7 between 1999 and 2020 (+9%/year). Around half of the production is exported (19 bcmin 2024), compared to 67% in 2010. Almost all the gas exports (96%) take the form of LNG.
Source: Nigeria energy report
Interactive Chart Nigeria Gas Production & Consumption
Source: Global Energy & CO2 data
Benefit from up to 2 000 up-to-date data series for 186 countries in Global Energy & CO2 data
Additionally, for more detailed information on the LNG trade, you can request a sample of our EMEA LNG Trade Dataset
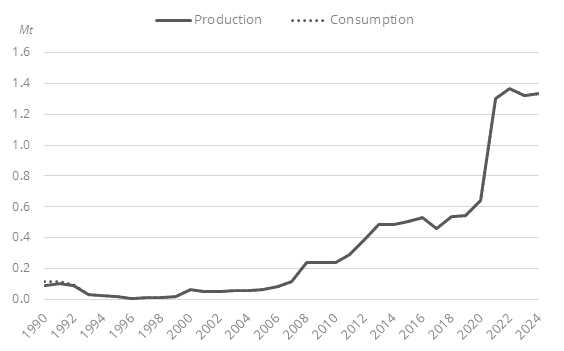
Nigeria Coal and Lignite Production & Consumption
Nigeria produces a limited volume of coal (1.3 Mt in 2024), which is entirely consumed domestically. Coal is exclusively consumed in industry.
Graph: Coal Production & Consumption
Source: Nigeria energy report
Interactive Chart Nigeria Coal and Lignite Production & Consumption
Source: Global Energy & CO2 data
Benefit from up to 2 000 up-to-date data series for 186 countries in Global Energy & CO2 data
View the detailed consumption trends at country level (graphs, tables, analysis) in the Nigeria energy report
Nigeria Renewable in % Electricity Production
In the ETP (2022), renewables are expected to account for 40% of capacity in 2030, totalling 17 GW (2.8 GW in 2024), and 96% in 2050 with 248 GW. The power sector should reach carbon neutrality by 2050.
The National Renewable Energy and Energy Efficiency Policy (2022) includes a "30:30:30" scheme that plans to add 30 GW of power capacity by 2030, with renewables contributing 30% of the country's energy mix.
Source: Nigeria energy report
Interactive Chart Nigeria Share of Renewables in Electricity Production (incl hydro)
Source: Global Energy & CO2 data
Benefit from up to 2 000 up-to-date data series for 186 countries in Global Energy & CO2 data
Nigeria GHG emissions and CO2 emissions
A National Council on Climate Change was created in 2021 by the Climate Change Act, a text which provides a framework for climate actions and sets to reach carbon neutrality over 2050-70.
Under its third NDC (3.0), Nigeria pledged to reduce its GHG emissions by 29% by 2030 and 32% by 2035, relative to 2018 levels. In addition, Nigeria committed to reach net-zero emissions by 2060.
Source: Nigeria energy report
Interactive Chart Nigeria CO2 emissions
Source: Global Energy & CO2 data
Benefit from up to 2 000 up-to-date data series for 186 countries in Global Energy & CO2 data
View the detailed consumption trends at country level (graphs, tables, analysis) in the Nigeria energy report