Nigeria Key Figures
- Population:
- 238 million
- GDP growth rate:
- 4.01 %/year
- Energy independence:
- 100%
Data of the last year available: 2025
- Total consumption/GDP:*
- 111 (2015=100)
- CO2 Emissions:
- 0.45 tCO2/cap
- Rate of T&D power losses:
- 8.91%
* at purchasing power parity
View all macro and energy indicators in the Nigeria energy report
Nigeria Energy News
View all news, archive your new and create your own daily newsletters only on your topics/countries of interest with Key Energy Intelligence
Nigeria Energy Research
- Nigeria's Energy & Climate Policy Framework: Nigeria targets 30% renewables by 2030, net-zero by 2060, and universal energy access via its Energy Transition Plan.
- Nigeria's Energy Companies: Several Nigerian energy distribution firms are insolvent and should be privatised. Major oil firms dominate production, while gas supply is controlled by Shell, TotalEnergies, Chevron, and Eni.
- Nigeria's Energy Supply & Demand: Nigeria’s oil & gas production rebounded post-2023, with oil covering 92% of demand. Gas share in energy mix rising; electricity capacity limited at 15 GW.
- Nigeria's Energy Use & Price by Sector: Final energy consumption rose 30% (2013-2025), with transport’s share growing from 25% to 33%. Households/services dominate demand (51%), followed by transport (31%) and industry (16%). Biomass remains primary energy source (48%), though oil products (39%) and gas (8%) are rising.
- Nigeria's Issues & Prospects: Nigeria’s energy sector faces rapid demand growth, with USUSD 1tn investment needed by 2050. Power capacity to expand to 250 GW (76% solar), while oil/gas projects surge, including Dangote’s 1.4mb/d refinery.
Benefit from up to 2 000 up-to-date data series for 186 countries in Global Energy & CO2 data
A data overview is available in the global energy statistics app
Nigeria Total Energy Production & Consumption
Since 2023, total consumption has increased by 6%/year, reaching 83 Mtoe in 2025. Previously, it fell by 3%/year between 2021 and 2023, after a phase of rapid growth over 2018-2021 (+8%/year).
Consumption per capita was 0.3 toe in 2025 (about a third lower than the average for Sub-Saharan Africa).
Source: Nigeria energy report
Interactive Chart Nigeria Total Energy Production & Consumption
Source: Global Energy & CO2 data
Benefit from up to 2 000 up-to-date data series for 186 countries in Global Energy & CO2 data
View the detailed fondamentals of the market at country level (graphs, tables, analysis) in the Nigeria energy report
Nigeria Oil Production & Consumption
Since 2023, oil production has rebounded by 7%/year to 74 Mt in 2025. In 2024, about 55% of the production came from offshore fields. Previously, between 2019 and 2023, oil output fell by 11%/year, from 100 Mt in 2019 to 64 Mt in 2023. In 2025, the country's output was about 1% lower than its OPEC quota (75 Mt), compared to 8% lower in 2024. Nigeria was the largest African oil producer in 2025, surpassing Angola, Libya, and Algeria.
Source: Nigeria energy report
Interactive Chart Nigeria Crude Oil Production & Consumption
Source: Global Energy & CO2 data
Interactive Chart Nigeria Refined Oil Products Production & Consumption
Source: Global Energy & CO2 data
Benefit from up to 2 000 up-to-date data series for 186 countries in Global Energy & CO2 data
Additionally, for more detailed information on refineries, you can request a sample of our EMEA Refineries Dataset
Nigeria Natural Gas Production & Consumption
Gas production in Nigeria has increased by 5%/year since 2023, reaching 41 bcm in 2025, which is still far from its peak level of 2020 (46 bcm). Output fell by 8%/year between 2020 and 2023, after a phase of moderate growth over 2011-2020 (+2%/year).
Source: Nigeria energy report
Interactive Chart Nigeria Gas Production & Consumption
Source: Global Energy & CO2 data
Benefit from up to 2 000 up-to-date data series for 186 countries in Global Energy & CO2 data
Additionally, for more detailed information on the LNG trade, you can request a sample of our EMEA LNG Trade Dataset
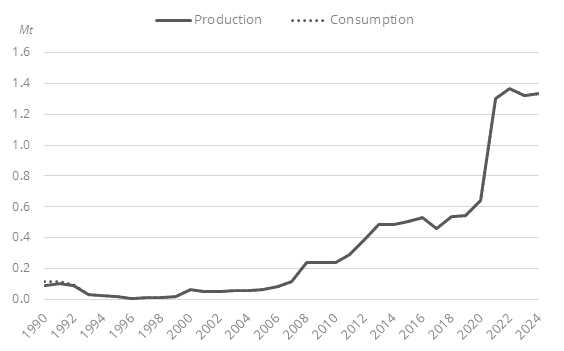
Nigeria Coal and Lignite Production & Consumption
Nigeria produces a limited volume of coal (1.1 Mt in 2025), which is entirely consumed domestically. Coal is exclusively consumed in industry.
Graph: Coal Production & Consumption
Source: Nigeria energy report
Interactive Chart Nigeria Coal and Lignite Production & Consumption
Source: Global Energy & CO2 data
Benefit from up to 2 000 up-to-date data series for 186 countries in Global Energy & CO2 data
View the detailed consumption trends at country level (graphs, tables, analysis) in the Nigeria energy report
Nigeria Renewable in % Electricity Production
In the ETP (2022), renewables are expected to account for 40% of capacity in 2030, totalling 17 GW 3 GW in 2025), and 96% in 2050 with 248 GW. The power sector should reach carbon neutrality by 2050.
The National Renewable Energy and Energy Efficiency Policy (2022) includes a "30:30:30" scheme that plans to add 30 GW of power capacity by 2030, with renewables contributing 30% of the country's energy mix.
Source: Nigeria energy report
Interactive Chart Nigeria Share of Renewables in Electricity Production (incl hydro)
Source: Global Energy & CO2 data
Benefit from up to 2 000 up-to-date data series for 186 countries in Global Energy & CO2 data
Nigeria GHG emissions and CO2 emissions
A National Council on Climate Change was created in 2021 by the Climate Change Act, a text which provides a framework for climate actions and sets to reach carbon neutrality over 2050-70.
Under its third NDC (3.0), Nigeria pledged to reduce its GHG emissions by 29% by 2030 and 32% by 2035, relative to 2018 levels. In addition, Nigeria committed to reach net-zero emissions by 2060.
Source: Nigeria energy report
Interactive Chart Nigeria CO2 emissions
Source: Global Energy & CO2 data
Benefit from up to 2 000 up-to-date data series for 186 countries in Global Energy & CO2 data
View the detailed consumption trends at country level (graphs, tables, analysis) in the Nigeria energy report