New Zealand Key Figures
- Population:
- 5.34 million
- GDP growth rate:
- -0.1 %/year
- Energy independence:
- 72.6%
Data of the last year available: 2024
- Total consumption/GDP:*
- 73.0 (2015=100)
- CO2 Emissions:
- 5.34 tCO2/cap
- Rate of T&D power losses:
- 7.32%
* at purchasing power parity
View all macro and energy indicators in the New Zealand energy report
New Zealand Energy News
View all news, archive your new and create your own daily newsletters only on your topics/countries of interest with Key Energy Intelligence
New Zealand Energy Research
- New Zealand's Energy & Climate Policy Framework: New Zealand aims for 90% renewable electricity by 2025, 51-55% GHG reduction by 2035, and carbon neutrality by 2050. Offshore exploration was reauthorised in 2025. The Ministry of Business, Innovation and Employment (MBIE) oversees energy policy, while the Ministry for the Environment (MfE) coordinates climate change efforts. The Climate Change Commission advises on emissions and policies. The Electricity Authority regulates the electricity market, and the NZ Petroleum & Minerals division manages oil, gas, and coal resources. The country has set ambitious targets for renewable energy and energy efficiency, with plans to phase out coal and promote electric vehicles. The Emissions Trading Scheme (NZ ETS) is a key tool for reducing emissions.
- New Zealand's Energy Companies: Four major firms dominate NZ's electricity market, with Meridian, Contact, Mercury, and Genesis generating ~80% of power. NZ's grid is well-developed, with renewable energy playing a significant role.
- New Zealand's Energy Supply & Demand: In 2024, New Zealand's energy supply saw renewables at 46% of total supply, with primary electricity rising to 40.5%. Total energy consumption decreased to 18.5 Mtoe. Electricity generation remained stable at 45 TWh, with renewables accounting for 85% of the mix. Oil and gas production declined, while coal use fluctuated. GHG emissions were 9% below 2005 levels.
- New Zealand's Energy Use & Price by Sector: Final energy demand has remained stable since 2020, with oil products and transport being the largest consumers. Industry and residential sectors show shifting energy source preferences, while prices fluctuate in line with international trends.
- New Zealand's Issues & Prospects: New Zealand plans 7 GW of wind and solar projects, with 1.6 GW under construction. Electricity demand is projected to grow 2-2.2% annually, requiring 10 GW of new capacity by 2040, primarily from renewables. Hydropower, geothermal, and battery storage projects are also advancing, while offshore wind faces regulatory hurdles.
Benefit from up to 2 000 up-to-date data series for 186 countries in Global Energy & CO2 data
A data overview is available in the global energy statistics app
New Zealand Total Energy Production & Consumption
Total primary energy consumption peaked in 2021 and has been decreasing since then, reaching 18.5 Mtoe in 2024 (-2.5 %/year).
Graph: Primary Consumption Trends by Energy Source
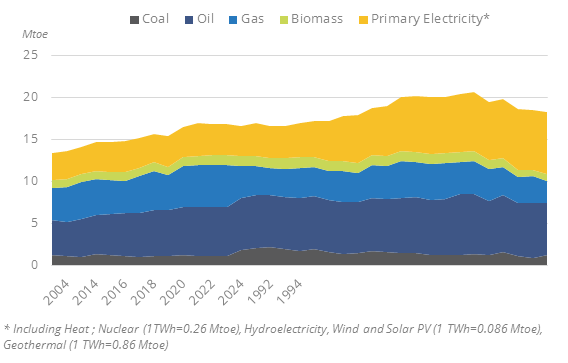
The share of natural gas has decreased by 2.3 pp since 2021, reaching 14.3% in 2024, while the share of primary electricity (hydro, geothermal, wind, and solar) has increased by 5.3 pp to 40.5 %. Oil's share has remained stable at 33%.
Source: New Zealand energy report
Interactive Chart New Zealand Total Energy Production & Consumption
Source: Global Energy & CO2 data
Benefit from up to 2 000 up-to-date data series for 186 countries in Global Energy & CO2 data
View the detailed fondamentals of the market at country level (graphs, tables, analysis) in the New Zealand energy report
New Zealand Oil Production & Consumption
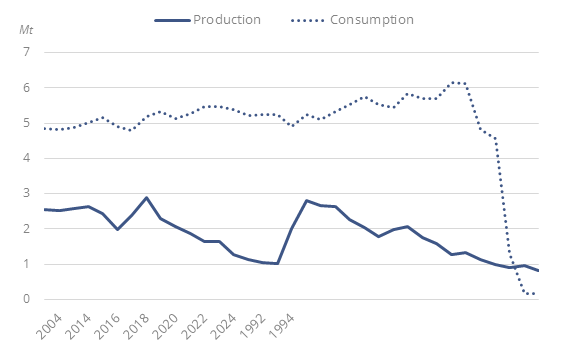
Crude oil and condensate production more than halved between 2015 and 2024, from 2.1 Mt to 0.8 Mt (-7%/year). It had already consistently decreased between 2010 and 2015(-4%/year). The five main oil and condensate fields are Maari, Maui, Kupe, Kapuni, and Turangi (78% of the country total production). Maari and Pohokura contain 56% of the remaining oil and condensates reserves.
Graph: Crude Oil Production & Consumption
Source: New Zealand energy report
Interactive Chart New Zealand Crude Oil Production & Consumption
Source: Global Energy & CO2 data
Interactive Chart New Zealand Refined Oil Products Production & Consumption
Source: Global Energy & CO2 data
Benefit from up to 2 000 up-to-date data series for 186 countries in Global Energy & CO2 data
Additionally, for more detailed information on refineries, you can request a sample of our Asia Refineries Dataset
New Zealand Natural Gas Production & Consumption
The production of natural gas has decreased by 4%/year since 2014, reaching 3.2 bcmin 2024. The peak production was reached in 2001 with 6.5 bcm.
The six largest gas fields are Maui, Mangahewa, Kupe, Turangi, Pohokura, and Kapuni (96% of the country total gas production). Pohokura accounts for 38% of remaining gas reserves.
Source: New Zealand energy report
Interactive Chart New Zealand Gas Production & Consumption
Source: Global Energy & CO2 data
Benefit from up to 2 000 up-to-date data series for 186 countries in Global Energy & CO2 data
Additionally, for more detailed information on the LNG trade, you can request a sample of our Asia LNG Trade Dataset
New Zealand Coal and Lignite Production & Consumption
Coal production fell rapidly between 2010 and 2016 from 5.3 Mt to 2.9 Mt (-6%/year) and has decreased more slowly since then (2.5 Mt in 2024, of which 50% is lignite, -2%/year). Coal consumption remains relatively stable since 2016, at 2.4 Mt. Coal consumption spikes in 2021 and 2024 can be explained by the substitution of gas generation in 2021 due to high prices and the substitution tofo hydro generation in 2024 due to low precipitation.
Source: New Zealand energy report
Interactive Chart New Zealand Coal and Lignite Production & Consumption
Source: Global Energy & CO2 data
Benefit from up to 2 000 up-to-date data series for 186 countries in Global Energy & CO2 data
View the detailed consumption trends at country level (graphs, tables, analysis) in the New Zealand energy report
New Zealand Renewable in % Electricity Production
New Zealand Energy Efficiency and Conservation Strategy (NZEECS) 2017-2022 has set a target of 90% of renewables in the power mix by 2025 (primarily hydro and geothermal).In 2023, the previous government announced an aspirational goal of 100% renewable electricity by 2030.
The second ERP (2024) includes a target of doubling renewable energy by 2050.
Source: New Zealand energy report
Interactive Chart New Zealand Share of Renewables in Electricity Production (incl hydro)
Source: Global Energy & CO2 data
Benefit from up to 2 000 up-to-date data series for 186 countries in Global Energy & CO2 data
Learn more about renewables in the Mini grid Africa & Asia markets for village electrification
New Zealand GHG emissions and CO2 emissions
In 2025, the government released its second NDC, which targets a GHG emissions reduction between 51 to 55% below 2005 levels by 2035 (compared to 50% by 2030 in the previous version of 2021).
Source: New Zealand energy report
Interactive Chart New Zealand CO2 emissions
Source: Global Energy & CO2 data
Benefit from up to 2 000 up-to-date data series for 186 countries in Global Energy & CO2 data
View the detailed consumption trends at country level (graphs, tables, analysis) in the New Zealand energy report