Japan Key Figures
- Population:
- 124 million
- GDP growth rate:
- 0.08 %/year
- Energy independence:
- 16.5%
Data of the last year available: 2024
- Total consumption/GDP:*
- 84.4 (2015=100)
- CO2 Emissions:
- 7.19 tCO2/cap
- Rate of T&D power losses:
- 4.38%
* at purchasing power parity
View all macro and energy indicators in the Japan energy report
Japan Energy News
View all news, archive your new and create your own daily newsletters only on your topics/countries of interest with Key Energy Intelligence
Japan Energy Research
- Japan's Energy & Climate Policy Framework: Japan aims for a 73% GHG reduction by 2040, with 60-72% CO2-free power. METI oversees energy policy, promoting renewables, nuclear, and efficiency. The 7th Strategic Energy Plan (2025) outlines targets, including phasing out coal and expanding LNG, hydrogen, and CCS. Market reforms include deregulated electricity and gas sectors, with auctions replacing FiTs for large-scale renewables. Japan also advances nuclear safety and hydrogen strategies to support its net-zero 2050 goal.
- Japan's Energy Companies: JERA leads Japan's energy sector, dominating power production and investing heavily in renewables and LNG. ENEOS is the top oil firm, while regional utilities and J-Power also play key roles. The sector is transitioning towards decarbonisation, with plans to phase out coal and expand hydrogen and ammonia use.
- Japan's Energy Supply & Demand: Japan ranks high in LNG, coal imports, and solar PV capacity. Renewables now make up 28.5% of its power mix, while total energy consumption has declined by 1.4% annually since 2010. Oil's share has slightly decreased, nuclear has partially recovered, and gas and coal remain significant. Japan aims for 60-72% CO2-free power generation by 2040.
- Japan's Energy Use & Price by Sector: Japan's final energy consumption has declined since 2010, with oil, electricity, and gas being the primary sources. Residential, services, and agriculture sectors lead demand, followed by industry and transport. Electricity's share is growing, while subsidies for gas and electricity extend to 2026, with gasoline subsidies ongoing. Energy prices have fluctuated, with recent decreases in industrial and transport sectors, while household electricity prices rose in 2024.
- Japan's Issues & Prospects: Japan aims to boost nuclear and offshore wind, reducing reliance on fossil fuels. By 2040, renewables and nuclear are expected to dominate the energy mix, with coal and oil significantly declining. The country plans to decommission 43 GW of thermal capacity by 2030 while expanding LNG and hydrogen-ready gas projects. Offshore wind targets 30-45 GW by 2040, supported by new auctions and joint ventures.
Benefit from up to 2 000 up-to-date data series for 186 countries in Global Energy & CO2 data
A data overview is available in the global energy statistics app
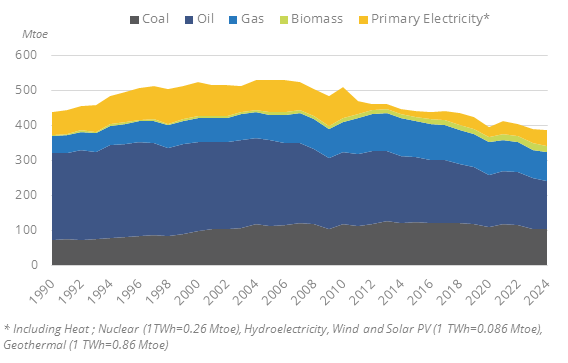
Japan Total Energy Production & Consumption
Total energy consumption has been decreasing by 1.4%/year on average since 2010, reaching 386 Mtoe in 2024. Energy consumption per capita was 3.1 toe in 2024; it is about 20% lower than the average for OECD Asia and Pacific.
Graph: Primary Consumption Trends by Energy Source
Source: Japan energy report
Interactive Chart Japan Total Energy Production & Consumption
Source: Global Energy & CO2 data
Benefit from up to 2 000 up-to-date data series for 186 countries in Global Energy & CO2 data
View the detailed fondamentals of the market at country level (graphs, tables, analysis) in the Japan energy report
Japan Oil Production & Consumption
Japan is the world's sixth largest oil importer. Crude oil imports decreased by 7% in 2024. They have been relatively stable over 2020-2023 (124 Mt average), 15% below their 2019 level.
As part of an IEA initiative of a coordinated oil release to mitigate surging crude oil prices, Japan released oil from privately held reserves between mid-2022 and mid-2024. Byend-2023, the total oil release amounted to 13.5 million barrels, i.e. 3% of the country's reserves (reserves represented 232 days of domestic demand in 2023).
Source: Japan energy report
Interactive Chart Japan Crude Oil Production & Consumption
Source: Global Energy & CO2 data
Interactive Chart Japan Refined Oil Products Production & Consumption
Source: Global Energy & CO2 data
Benefit from up to 2 000 up-to-date data series for 186 countries in Global Energy & CO2 data
Additionally, for more detailed information on refineries, you can request a sample of our Asia Refineries Dataset
Japan Natural Gas Production & Consumption
Gas imports increased slightly in 2024 to 95.6 bcm (+2.3%), after a sharp decrease in 2023(-8%), mainly due to higher nuclear availability and the expansion of renewables. Gas imports have been decreasing since 2014 (-3.5%/year over 2014-2023). Japan has long been the world's largest LNG importer and now stands behind China. It now accounts for 17% of the world's LNG imports. Between 2010 and 2014, imports had increased rapidly to compensate for the drop in nuclear production.
Source: Japan energy report
Interactive Chart Japan Gas Production & Consumption
Source: Global Energy & CO2 data
Benefit from up to 2 000 up-to-date data series for 186 countries in Global Energy & CO2 data
Additionally, for more detailed information on the LNG trade, you can request a sample of our Asia LNG Trade Dataset
Japan Coal and Lignite Production & Consumption
Hard coal imports remained relatively stable in 2024 at 166 Mt, after a sharp decreasein 2023 (-10%). They decreased regularly over 2013-2022 (0.9%/year), from a peak at 196 Mt. Japan is the world's third largest coal importer, behind China and India.
Coal consumption remained stable in 2024 at 157 Mt, following a 9% drop in 2023 and a decline of around 1%/year between 2013 and 2022.
Source: Japan energy report
Interactive Chart Japan Coal and Lignite Production & Consumption
Source: Global Energy & CO2 data
Benefit from up to 2 000 up-to-date data series for 186 countries in Global Energy & CO2 data
View the detailed consumption trends at country level (graphs, tables, analysis) in the Japan energy report
Japan Renewable in % Electricity Production
By formulating the 7th Strategic Energy Plan (2025), METI aims to raise the share of renewables in the power mix to 40-50% (including hydropower) in 2040, with plans to make renewables the main power source in 2050 (29% carbon free in 2024).
Feed-in tariffs (FiTs) were removed in 2020 for large solar PV (>250 kW) and in 2023 for wind (>50 kW). They were replaced by a tendering program initiated by METI. The country awarded a total of 420 MW of solar PV in FY2024 (20th to 23rd auctions) and 444 MW in only five auctions in 2023 (15th to 19th auctions).
Source: Japan energy report
Interactive Chart Japan Share of Renewables in Electricity Production (incl hydro)
Source: Global Energy & CO2 data
Benefit from up to 2 000 up-to-date data series for 186 countries in Global Energy & CO2 data
Learn more about renewables in the Mini grid Africa & Asia markets for village electrification
Japan GHG emissions and CO2 emissions
In February 2025, Japan updated its NDC target to a 73% reduction in GHG emissions by 2040 compared to 2013 (60% by 2035). This would correspond to reaching an emission level of 570 MtCO2eq in 2035 and 380 MtCO2eq in 2040. The 2013 reference corresponds to Japan's peak of GHG emissions in the aftermath of the Fukushima disaster and when thermal power generation was at its highest level. The long-term goal, announced in 2019 in the long-term growth strategy under the Paris Agreement, is to become carbon neutral in 2050.
Source: Japan energy report
Interactive Chart Japan CO2 emissions
Source: Global Energy & CO2 data
Benefit from up to 2 000 up-to-date data series for 186 countries in Global Energy & CO2 data
View the detailed consumption trends at country level (graphs, tables, analysis) in the Japan energy report