Hong Kong Key Figures
- Population:
- 7.52 million
- GDP growth rate:
- 2.54 %/year
Data of the last year available: 2024
- Total consumption/GDP:*
- 76.8 (2015=100)
- CO2 Emissions:
- 4.07 tCO2/cap
- Rate of T&D power losses:
- 7.25%
* at purchasing power parity
View all macro and energy indicators in the Hong Kong energy report
Hong Kong Energy News
View all news, archive your new and create your own daily newsletters only on your topics/countries of interest with Key Energy Intelligence
Hong Kong Energy Research
- Hong-Kong's Energy & Climate Policy Framework: Hong Kong aims to reduce CO2 intensity by 65-70% by 2030 and achieve net-zero electricity by 2050. The government regulates energy through multiple departments, promoting efficiency and renewables while phasing out coal. Electricity and gas tariffs are controlled via agreements, with recent reductions announced. Renewable energy schemes and energy efficiency measures are in place to support these goals.
- Hong-Kong's Energy Companies: CLP Power dominates Hong Kong's electricity sector, with 70% capacity and 80% consumer supply. It operates coal, gas, and diesel plants, aiming for net-zero emissions by 2050. HK Electric serves the remaining market. Towngas holds a monopoly on gas distribution. United Energy Group leads the oil sector, with global operations and recent acquisitions.
- Hong-Kong's Energy Supply & Demand: Hong Kong relies on energy imports, with gas dominating its energy mix (67% of power generation) and replacing coal. Total energy consumption has declined since 2018, with gas and coal being the primary sources. The territory imports oil, gas, and coal, with limited renewable energy potential. Electricity consumption remains high, primarily driven by residential and service sectors.
- Hong-Kong's Energy Use & Price by Sector: Hong Kong's 2024 energy consumption stabilised at 7 Mtoe, with electricity and oil dominating. Prices remain significantly higher than mainland China, notably in transport and industry. Residential and services sectors account for two-thirds of demand.
- Hong-Kong's Issues & Prospects: Hong Kong aims to phase out coal-fired power by 2035, shifting to natural gas and renewables, with 3-4% of electricity from wind, solar, and waste-to-energy by 2030. New gas and biomass projects are under construction, alongside planned wind and gas capacity.
Benefit from up to 2 000 up-to-date data series for 186 countries in Global Energy & CO2 data
A data overview is available in the global energy statistics app
Hong Kong Total Energy Production & Consumption
Total energy consumption declined by 2% in 2024 to 11.7 Mtoe, after a 5% rebound in 2023. It has been declining by around 3%/year since 2018, with significant drops in 2020 (-13%) and 2022 (-9%). Previously, it had been fluctuating around 14 Mtoe over 2010-2018. At 1.6 toe, total energy consumption per capita is 9% below the average in Asia.
Source: Hong Kong energy report
Interactive Chart Hong Kong Total Energy Production & Consumption
Source: Global Energy & CO2 data
Benefit from up to 2 000 up-to-date data series for 186 countries in Global Energy & CO2 data
View the detailed fondamentals of the market at country level (graphs, tables, analysis) in the Hong Kong energy report
Hong Kong Oil Production & Consumption
Hong Kong does not produce any oil. Almost all of the oil products are imported from mainland China (more than 80% in 2024). Imports reached 16.4 Mt in 2024, a 10% increase compared to 2023. Imports have been decreasing sharply since 2018 (-12%/year) but rebounded by 35% in 2023.
Oil product consumption remained broadly stable in 2024 (-1% compared to the previous year), following a strong rebound in 2023 (18%). Prior to that, consumption had experienced two significant declines in 2021 (-10%) and 2022 (-26%). Since 2010, it has increased at an average annual rate of 2%.
Source: Hong Kong energy report
Interactive Chart Hong Kong Crude Oil Production & Consumption
Source: Global Energy & CO2 data
Interactive Chart Hong Kong Refined Oil Products Production & Consumption
Source: Global Energy & CO2 data
Benefit from up to 2 000 up-to-date data series for 186 countries in Global Energy & CO2 data
Additionally, for more detailed information on refineries, you can request a sample of our Asia Refineries Dataset
Hong Kong Natural Gas Production & Consumption
Hong Kong does not produce any gas. Most of the gas consumed is imported by pipeline from mainland China (around 85% in 2024), even though Hong Kong has diversified its imports with LNG (1 bcm in 2024), mainly from Qatar. Since 2014, gas consumption has been increasing by an average of 9%/year, reaching 5.7 bcm in 2024. More than 90% of gas consumed is used for power generation, with the remainder consumed in buildings.
Source: Hong Kong energy report
Interactive Chart Hong Kong Gas Production & Consumption
Source: Global Energy & CO2 data
Benefit from up to 2 000 up-to-date data series for 186 countries in Global Energy & CO2 data
Additionally, for more detailed information on the LNG trade, you can request a sample of our Asia LNG Trade Dataset
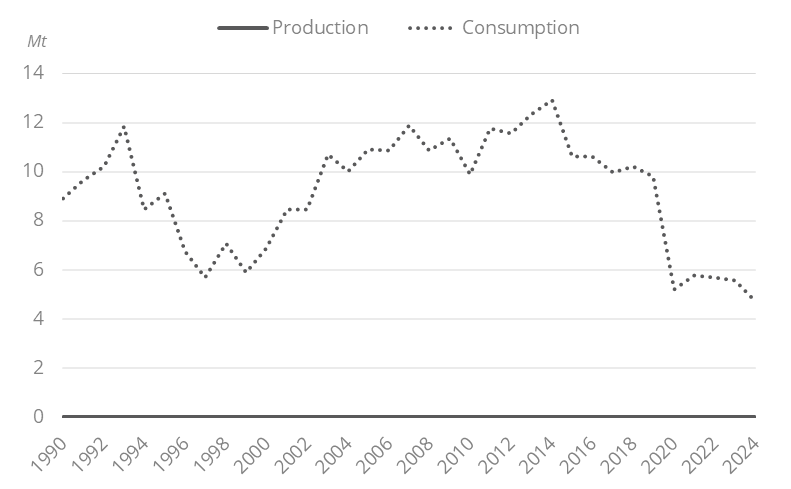
Hong Kong Coal and Lignite Production & Consumption
Hong Kong does not produce coal and relies entirely on imports to meet its consumption (50% of imports come from Vietnam and 50% from mainland China). Coal use fell significantly in 2024 (-15%), marking the third consecutive year of decline. Since 2014, coal consumption has declined at an average rate of 10%/year. All the coal is used for power generation.
Graph: Coal Production & Consumption
Source: Hong Kong energy report
Interactive Chart Hong Kong Coal and Lignite Production & Consumption
Source: Global Energy & CO2 data
Benefit from up to 2 000 up-to-date data series for 186 countries in Global Energy & CO2 data
View the detailed consumption trends at country level (graphs, tables, analysis) in the Hong Kong energy report
Hong Kong Renewable in % Electricity Production
In 2018, the ENB launched a solar feed-in tariff (FiT) scheme to encourage the development of small solar PV systems and facilitate the sale of solar power to utilities. Under the scheme, HEC and CLP will buy solar power at HK$4/kWh (US$51c/kWh) for systems up to 10 kW, HK$3/kWh (US$38c/kWh) for systems between 10 kW and 200 kW, and HK$2.5/kWh (US$32c/kWh) for systems up to 1 MW. The FiT rate fixed for a RES when joining the FiT scheme remains unchanged and is valid throughout the project's life or until end-2033, whichever is earlier. The FiT rates are reviewed and published annually.
Source: Hong Kong energy report
Interactive Chart Hong Kong Share of Renewables in Electricity Production (incl hydro)
Source: Global Energy & CO2 data
Benefit from up to 2 000 up-to-date data series for 186 countries in Global Energy & CO2 data
Learn more about renewables in the Mini grid Africa & Asia markets for village electrification
Hong Kong GHG emissions and CO2 emissions
As a part of China, Hong Kong has to contribute to China's NDC target, which is to reduce CO2 intensity to GDP by over 65% by 2030 as compared to 2005. In its NDC 3.0, releasedin November 2025, China also aims for a reduction of net GHG emissions by 7-10% by 2035 from peak levels.
Source: Hong Kong energy report
Interactive Chart Hong Kong CO2 emissions
Source: Global Energy & CO2 data
Benefit from up to 2 000 up-to-date data series for 186 countries in Global Energy & CO2 data
View the detailed consumption trends at country level (graphs, tables, analysis) in the Hong Kong energy report