Egypt Key Figures
- Population:
- 117 million
- GDP growth rate:
- 2.40 %/year
- Energy independence:
- 75.7%
Data of the last year available: 2024
- Total consumption/GDP:*
- 82.2 (2015=100)
- CO2 Emissions:
- 1.82 tCO2/cap
- Rate of T&D power losses:
- 15.3%
* at purchasing power parity
View all macro and energy indicators in the Egypt energy report
Egypt Energy News
View all news, archive your new and create your own daily newsletters only on your topics/countries of interest with Key Energy Intelligence
Egypt Energy Research
- Egypt's Energy & Climate Policy Framework: Egypt aims for 42% renewables in its power mix by 2030, with key ministries overseeing energy and climate policies. The electricity market is gradually liberalising, while oil and gas sectors see modernisation and investment drives. Renewables, green hydrogen, and nuclear energy are prioritised, with targets set for 2030 and 2040. Energy efficiency measures and a voluntary carbon market are also in place.
- Egypt's Energy Companies: EEHC dominates Egypt's power sector, generating 94% of electricity. EETC, now independent, manages transmission. EGPC and APA lead oil production, with EGPC expanding refineries. Eni and BP are key gas producers, with EGAS overseeing supply. Distribution networks serve millions, with state and private firms involved.
- Egypt's Energy Supply & Demand: Egypt's energy supply relies heavily on oil and gas, which together account for 89% of primary consumption in 2024. Gas dominates electricity generation (81%) and installed capacity (83%). Despite declining domestic gas production, Egypt has become a net importer, with significant imports from Israel. Renewable energy sources, including wind and solar, contribute modestly to the energy mix. The country's electricity network is interconnected with several neighbouring nations, ensuring energy security. Overall, Egypt faces challenges in balancing energy demand with declining domestic production and increasing reliance on imports.
- Egypt's Energy Use & Price by Sector: Egypt's final energy consumption has risen by 5% annually since 2020, reaching 70 Mtoe in 2024, with oil and electricity being primary sources. Industrial and transport sectors dominate demand, while IMF-driven reforms have led to fluctuating energy prices in pounds and dollars.
- Egypt's Issues & Prospects: Egypt is advancing its energy sector with significant nuclear, renewable, and gas projects. The El Dabaa nuclear plant is under construction for completion by 2030. Major solar and wind projects are planned, alongside gas supply agreements with Israel. Investments in green hydrogen and infrastructure upgrades are also underway, aiming to enhance energy security and export capabilities.
Benefit from up to 2 000 up-to-date data series for 186 countries in Global Energy & CO2 data
A data overview is available in the global energy statistics app
Egypt Total Energy Production & Consumption
Primary consumption showed considerable growth of 5% in 2024, reaching 98 Mtoe after two consecutive years of decline in 2023 (-1%) and 2022 (-6%). It grew by 2.5%/year on average from 2010 to 2021.
Source: Egypt energy report
Interactive Chart Egypt Total Energy Production & Consumption
Source: Global Energy & CO2 data
Benefit from up to 2 000 up-to-date data series for 186 countries in Global Energy & CO2 data
View the detailed fondamentals of the market at country level (graphs, tables, analysis) in the Egypt energy report
Egypt Oil Production & Consumption
Crude oil production has declined by 10% since 2019, reaching 29 Mt -5%/year in 2024, after fluctuating around 34-35 Mt since 2008. Production is concentrated in the Western Desert (56%) and the Gulf of Suez (23%). Egypt consumes almost all its oil production. Crude oil consumption has been constant since 2010, hovering around 29 Mt, reaching 28 Mt (-3%)in 2024.
Source: Egypt energy report
Interactive Chart Egypt Crude Oil Production & Consumption
Source: Global Energy & CO2 data
Interactive Chart Egypt Refined Oil Products Production & Consumption
Source: Global Energy & CO2 data
Benefit from up to 2 000 up-to-date data series for 186 countries in Global Energy & CO2 data
Additionally, for more detailed information on refineries, you can request a sample of our EMEA Refineries Dataset
Egypt Natural Gas Production & Consumption
Gas production has been decreasing very rapidly since its peak in 2021 at 71 bcm (-14%/year), reaching 45 bcm in 2024. This decline is due to a reduction at the main natural gas field - Zohr. Gas production grew rapidly following the commissioning of the Zohr field in 2017 (+7%/year over 2017-2021). Egypt is the second largest gas producer in Africa after Algeria, close to Nigeria. The Mediterranean Sea represents the largest share of gas production with 62%, followed by the Nile Delta with 19% and the western desert with 18%.
Source: Egypt energy report
Interactive Chart Egypt Gas Production & Consumption
Source: Global Energy & CO2 data
Benefit from up to 2 000 up-to-date data series for 186 countries in Global Energy & CO2 data
Additionally, for more detailed information on the LNG trade, you can request a sample of our EMEA LNG Trade Dataset
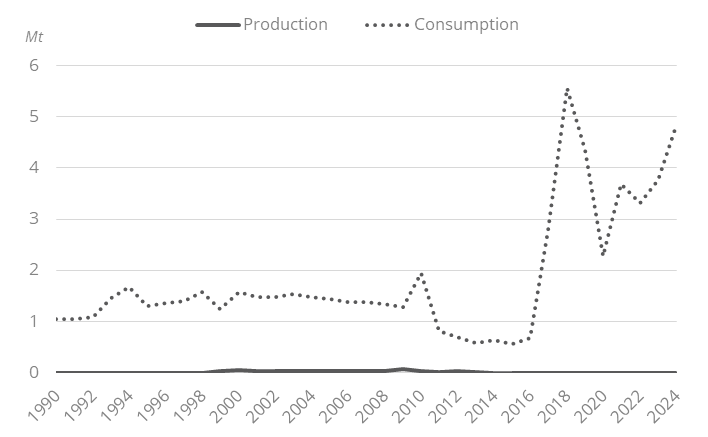
Egypt Coal and Lignite Production & Consumption
Egypt does not have any domestic production of coal and depends on imports. Coal consumption has increased rapidly since 2020 (+20%/year), reaching 4.8 Mt in 2024, close to its pre-Covid level. Coal is dominantly used in the industrial sector (89%), in addition to replacing gas when its price increases.
Graph: Coal Production & Consumption
Source: Egypt energy report
Interactive Chart Egypt Coal and Lignite Production & Consumption
Source: Global Energy & CO2 data
Benefit from up to 2 000 up-to-date data series for 186 countries in Global Energy & CO2 data
View the detailed consumption trends at country level (graphs, tables, analysis) in the Egypt energy report
Egypt Renewable in % Electricity Production
NREA, New & Renewable Energy Authority, was created in 1986 under the supervision of MERE to promote renewables. The Renewable Energy Law (2014) establishes different schemes for the private development of renewable energy projects, including the IPP public competitive bidding process, feed-in tariffs (FIT), and private-to-private sale of electricity from renewables.
Source: Egypt energy report
Interactive Chart Egypt Share of Renewables in Electricity Production (incl hydro)
Source: Global Energy & CO2 data
Benefit from up to 2 000 up-to-date data series for 186 countries in Global Energy & CO2 data
Egypt GHG emissions and CO2 emissions
In its updated NDC (2023), the country increased its GHG emissions reduction target to 37% by 2030, instead of 33% in the 2022 update (reduction relative to a BaU scenario). This new objective implies a level of emissions of around 134 MtCO2eq in 2030 and a reduction of 80.5 MtCO2eq compared to the BAU scenario.
Source: Egypt energy report
Interactive Chart Egypt CO2 emissions
Source: Global Energy & CO2 data
Benefit from up to 2 000 up-to-date data series for 186 countries in Global Energy & CO2 data
View the detailed consumption trends at country level (graphs, tables, analysis) in the Egypt energy report