Egypt Key Figures
- Population:
- 118 million
- GDP growth rate:
- 4.39 %/year
- Energy independence:
- 73.5%
Data of the last year available: 2025
- Total consumption/GDP:*
- 72.0 (2015=100)
- CO2 Emissions:
- 1.70 tCO2/cap
- Rate of T&D power losses:
- 18.5%
* at purchasing power parity
View all macro and energy indicators in the Egypt energy report
Egypt Energy News
View all news, archive your new and create your own daily newsletters only on your topics/countries of interest with Key Energy Intelligence
Egypt Energy Research
- Egypt's Energy & Climate Policy Framework: Egypt aims for 42% renewables in its power mix by 2030, with key ministries overseeing energy and climate policies. The electricity market is gradually liberalising, while oil and gas sectors see modernisation and investment drives. Renewables and green hydrogen are prioritised, with nuclear and efficiency measures also in focus.
- Egypt's Energy Companies: EEHC dominates Egypt's power sector, generating 94% of electricity. EETC, separated in 2025, manages transmission. EGPC and APA lead oil production, with key players like Eni and BP in gas.
- Egypt's Energy Supply & Demand: Egypt's energy supply relies heavily on oil and gas (89% in 2024), with gas dominating electricity generation (81%). Gas production has declined since 2021, leading to increased imports. Total energy consumption rose by 5% in 2024, reaching 98 Mtoe. The country has significant hydrocarbon resources and renewable energy potential, with growing solar and wind capacities. Electricity generation has expanded at 3% annually since 2010, while CO2 intensity has decreased by 29% since 2019.
- Egypt's Energy Use & Price by Sector: Energy demand in Egypt has risen by 5% annually since 2020, with industry, transport, and households each accounting for 28-34% of consumption. Oil remains dominant, though electricity's share has grown. IMF-backed reforms have led to rising energy prices in Egyptian pounds, despite declines in US dollar terms.
- Egypt's Issues & Prospects: Egypt is advancing its energy sector with significant nuclear, renewable, and gas projects. The El Dabaa nuclear plant is under construction for completion by 2030. Major solar and wind projects are in development, alongside gas supply agreements with Israel. Additionally, Egypt is investing in green hydrogen and refining capacity expansions.
Benefit from up to 2 000 up-to-date data series for 186 countries in Global Energy & CO2 data
A data overview is available in the global energy statistics app
Egypt Total Energy Production & Consumption
After reaching a peak at 101 Mt in 2021, total primary consumption has declined by 2%/year to 93 Mtoe in 2025. Previously, it increased by 4%/year between 2015 and 2021.
Energy consumption per capita stood at 0.8 toe in 2025, a level that is 8% lower than 2010
Source: Egypt energy report
Interactive Chart Egypt Total Energy Production & Consumption
Source: Global Energy & CO2 data
Benefit from up to 2 000 up-to-date data series for 186 countries in Global Energy & CO2 data
View the detailed fondamentals of the market at country level (graphs, tables, analysis) in the Egypt energy report
Egypt Oil Production & Consumption
Crude oil production has declined by almost 3%/year since 2019, reaching 28 Mt in 2025, after a period of stability at 34 Mt/year between 2008 and 2019. Production is concentrated in the Western Desert (56%) and the Gulf of Suez (23%).
In 2020, Egypt became net importer of crude oil. Net imports reached 1 Mt in 2025. Since 2021, crude oil consumption has declined by 3%/year, reaching 31 Mt in 2025. Previously, it increased by 6%/year between 2016 and 2021.
Graph: Crude Oil Production & Consumption
Source: Egypt energy report
Interactive Chart Egypt Crude Oil Production & Consumption
Source: Global Energy & CO2 data
Interactive Chart Egypt Refined Oil Products Production & Consumption
Source: Global Energy & CO2 data
Benefit from up to 2 000 up-to-date data series for 186 countries in Global Energy & CO2 data
Additionally, for more detailed information on refineries, you can request a sample of our EMEA Refineries Dataset
Egypt Natural Gas Production & Consumption
After peaking at 71 bcm in 2021, gas production has declined by 15%/year to 38 bcm in 2025, as output at the country's main natural gas field fell. Egypt is the third largest gas producer in Africa after Algeria and Nigeria. Previously, gas output rose by 11%/year, following the start of the Zohr field in 2017. The Mediterranean Sea represents the largest share of gas production with 62%, followed by the Nile Delta with 19% and the western desert with 18%.
Source: Egypt energy report
Interactive Chart Egypt Gas Production & Consumption
Source: Global Energy & CO2 data
Benefit from up to 2 000 up-to-date data series for 186 countries in Global Energy & CO2 data
Additionally, for more detailed information on the LNG trade, you can request a sample of our EMEA LNG Trade Dataset
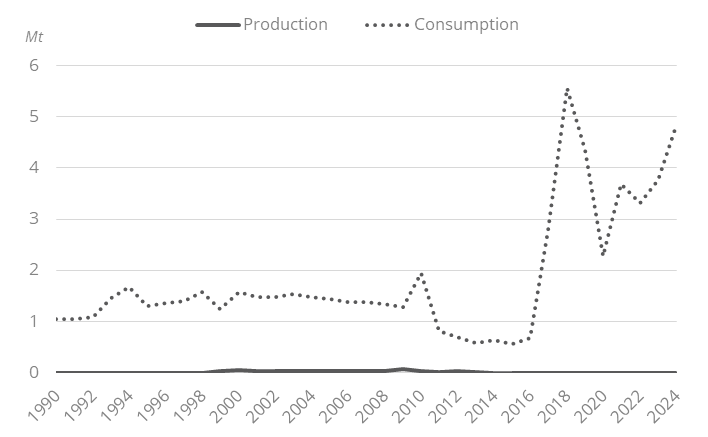
Egypt Coal and Lignite Production & Consumption
Egypt does not have any domestic production of coal and depends entirely on imports. Coal consumption is low and fluctuating, reaching 3 Mt in 2025. Coal is mainly consumed in the industrial sector (90%).
Graph: Coal Production & Consumption
Source: Egypt energy report
Interactive Chart Egypt Coal and Lignite Production & Consumption
Source: Global Energy & CO2 data
Benefit from up to 2 000 up-to-date data series for 186 countries in Global Energy & CO2 data
View the detailed consumption trends at country level (graphs, tables, analysis) in the Egypt energy report
Egypt Renewable in % Electricity Production
NREA, New & Renewable Energy Authority, was created in 1986 under the supervision of MERE to promote renewables. The Renewable Energy Law (2014) establishes different schemes for the private development of renewable energy projects, including the IPP public competitive bidding process, feed-in tariffs (FIT), and private-to-private sale of electricity from renewables.
Source: Egypt energy report
Interactive Chart Egypt Share of Renewables in Electricity Production (incl hydro)
Source: Global Energy & CO2 data
Benefit from up to 2 000 up-to-date data series for 186 countries in Global Energy & CO2 data
Egypt GHG emissions and CO2 emissions
In its updated NDC (2023), the country increased its GHG emissions reduction target to 37% by 2030, instead of 33% in the 2022 update (reduction relative to a BaU scenario). This new objective implies a level of emissions of around 134 MtCO2eq in 2030 and a reduction of 80.5 MtCO2eq compared to the BAU scenario.
Source: Egypt energy report
Interactive Chart Egypt CO2 emissions
Source: Global Energy & CO2 data
Benefit from up to 2 000 up-to-date data series for 186 countries in Global Energy & CO2 data
View the detailed consumption trends at country level (graphs, tables, analysis) in the Egypt energy report