Congo Key Figures
- Population:
- 6.18 million
- GDP growth rate:
- 1.91 %/year
- Energy independence:
- 100%
Data of the last year available: 2023
- Total consumption/GDP:*
- 155 (2015=100)
- CO2 Emissions:
- 0.63 tCO2/cap
- Rate of T&D power losses:
- 50.3%
* at purchasing power parity
View all macro and energy indicators in the Congo energy report
Congo Energy News
View all news, archive your new and create your own daily newsletters only on your topics/countries of interest with Key Energy Intelligence
Congo Energy Research
- Congo's Energy & Climate Policy Framework: Congo's economy relies heavily on oil and gas, with recent reforms in energy regulation and a focus on expanding renewable energy and reducing emissions. The country aims to diversify its energy mix and attract investment in gas and hydropower projects.
- Congo's Energy Companies: Congo's energy sector is dominated by state-owned and private firms. Centrale Electrique du Congo (CEC) and Energie Electrique du Congo (E2C) lead electricity generation, with CEC contributing 55% of capacity. In oil, Perenco and TotalEnergies are key producers, while Eni and Chevron have recently divested assets. SNPC oversees downstream operations, including the Pointe-Noire refinery. Eni dominates natural gas production. The government is liberalising the power sector by privatising hydropower plants.
- Congo's Energy Supply & Demand: "Congo's energy mix relies heavily on biomass (49%) and gas (24%), with gas dominating power generation (67%). Energy demand grew 3% annually since 2020, reaching 3.7 Mtoe in 2023. The country began LNG exports in 2024, leveraging significant hydrocarbon reserves. Electricity capacity stands at 830 MW, with high transmission losses (50%). Oil production increased to 14.3 Mt in 2023, while gas production remained stable at 1.1 bcm, with LNG exports commencing. GHG emissions were 23.5 MtCO₂eq in 2023, with hydrocarbons contributing significantly."
- Congo's Energy Use & Price by Sector: Final energy consumption in Congo has stabilised since 2019, with biomass as the primary source. Households and services account for 74% of usage, while transport relies solely on oil. Energy prices have remained steady in 2024 after a 2022 surge.
- Congo's Issues & Prospects: Congo plans to double its power generation to 1.5 GW by 2030, focusing on gas (70%) and hydro (30%). Key projects include expanding the Djeno gas plant, developing the Chollet hydropower project, and launching solar initiatives. Transmission network upgrades are also underway.
Benefit from up to 2 000 up-to-date data series for 186 countries in Global Energy & CO2 data
A data overview is available in the global energy statistics app
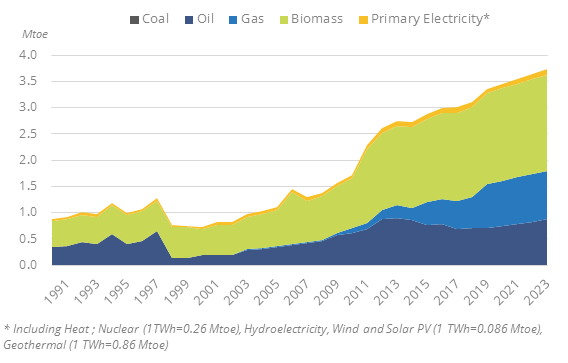
Congo Total Energy Production & Consumption
Total energy consumption has increased by 3%/year since 2020, reaching 3.7 Mtoe in 2023, after strong growth of 8% in 2019. In 2023, total energy consumption per inhabitant was around 0.6 toe (0.2 toe without biomass), in line with the Sub-Saharan Africa average.
Graph: Primary Consumption Trends by Energy Source
Source: Congo energy report
Interactive Chart Congo Total Energy Production & Consumption
Source: Global Energy & CO2 data
Benefit from up to 2 000 up-to-date data series for 186 countries in Global Energy & CO2 data
View the detailed fondamentals of the market at country level (graphs, tables, analysis) in the Congo energy report
Congo Oil Production & Consumption
Oil production increased by 5% in 2023 to 14.3 Mt, after declining by 20% between 2019 and 2022. It rose by 21% in 2018 with the commissioning of several new fields (Moho Nord deep offshore, Lianzi, and Nené Marine). Production had previously been decreasing between 2010 and 2016, following a rapid increase between 2007 and 2010 (+12%/year) with the start of several fields: the first deep offshore field, Moho Bilondo, in 2008 (90 kb/d), the Awa-Paloukou and Ikalou-Ikalou fields (peak production of 13 kb/d for the two fields) in 2008, and the Azurite field (40 kb/d) in 2009.
Source: Congo energy report
Interactive Chart Congo Crude Oil Production & Consumption
Source: Global Energy & CO2 data
Interactive Chart Congo Refined Oil Products Production & Consumption
Source: Global Energy & CO2 data
Benefit from up to 2 000 up-to-date data series for 186 countries in Global Energy & CO2 data
Additionally, for more detailed information on refineries, you can request a sample of our EMEA Refineries Dataset
Congo Natural Gas Production & Consumption
Marketed gas production remained stable in 2023 (1.1 bcm), after slow growth from 2020 to 2022 (3%/year). It increased very rapidly from 0.1 bcm in 2010 to 0.53 bcm in 2015 and 1.05 bcm in 2020 (+15%/year from 2015 to 2020). In 2024, production grew strongly (+50%). Most of the production is associated with oil production. Half of the gross gas production is flared or reinjected (33% flared and 17% reinjected in 2024 according to Cedigaz).
Source: Congo energy report
Interactive Chart Congo Gas Production & Consumption
Source: Global Energy & CO2 data
Benefit from up to 2 000 up-to-date data series for 186 countries in Global Energy & CO2 data
Additionally, for more detailed information on the LNG trade, you can request a sample of our EMEA LNG Trade Dataset
Congo Renewable in % Electricity Production
The Ministry of Energy has announced that the country plans to double its power generation capacity to over 1.5 GW by 2030, largely through the development of renewables, especially hydropower projects.
Source: Congo energy report
Interactive Chart Congo Share of Renewables in Electricity Production (incl hydro)
Source: Global Energy & CO2 data
Benefit from up to 2 000 up-to-date data series for 186 countries in Global Energy & CO2 data
Congo GHG emissions and CO2 emissions
In its updated NDC (2021), Congo set an unconditional GHG emission reduction target of 21.5% (excluding forests) compared to a BAU scenario in 2030 and a conditional reduction target of 32%.
Under its BAU scenario, GHG emissions are expected to rise from 11.4 MtCO2eq in 2020 to 15.3 MtCO2eq in 2030, of which 10.2 MtCO2eq from the energy sector. The unconditional reduction target would limit GHG emissions to 12 MtCO2eq in 2030 (of which 9.4 MtCO2eq from the energy sector), while the conditional reduction target could limit them to 7.1 MtCO2eq.
Source: Congo energy report
Interactive Chart Congo CO2 emissions
Source: Global Energy & CO2 data
Benefit from up to 2 000 up-to-date data series for 186 countries in Global Energy & CO2 data
View the detailed consumption trends at country level (graphs, tables, analysis) in the Congo energy report