
- Update
-
- Format
- 3 files (PDF report, 2 Excel files)
- Pages
-
49 (Report only)
- Delivery
- Immediate by e-mail
- GENERAL OVERVIEW
- ENERGY AND CLIMATE POLICY FRAMEWORK
- ENERGY COMPANIES
- ENERGY SUPPLY AND DEMAND
- ENERGY USE AND PRICE BY SECTOR
- ISSUES AND PROSPECTS
- STATISTICS
- ABBREVIATIONS
- GLOSSARY
Buy Congo energy report
Price without VAT. Depending on your status and location, VAT might be applicable. Get in touch with us for more information.
After validation, you will immediately receive 3 files by email (one pdf report and 2 excel files containing the datasets).
Overview
Congo’s economy relies heavily on oil and gas. The government is promoting energy diversification and electrification through new national pacts and infrastructure projects.
Get more details on the table of contents and data files, as well as the list of graphs and tables by browsing the tabs below.
Highlights
- Congo's economy is mainly based on oil and gas revenues.
- Centrale Electrique du Congo and Energie Electrique du Congo account for nearly 70% of the total installed capacity.
- Gas represents more than 2/3 of power generation.
- The country started exporting LNG in 2024.
- Final energy consumption has remained stable since 2020.
- Biomass is the main energy consumed by final consumers.
- Households and services consumed around three fourths of final energy.
- Several hydropower projects are under development.
- A new plan to enhance the electricity transmission network was launched in July 2025.
Energy & Climate Policy Framework
The Ministry of Energy and Hydraulics defines the energy policy. The Ministry of Hydrocarbons manages the country's oil and gas resources. The Ministry of the Environment, the Congo Basin, and Sustainable Development is in charge of climate policy. The Ministry of the Forest Economy is involved in the conservation and sustainable use of the country's biomass resources.
Energy Companies
Gas:
Eni is the leading natural gas producer, with a production of 2.4 bcm in 2025 (+12%).
Energy Supply & Demand
Resources:
The country has relatively large reserves of hydrocarbons (246 Mt of oil and 284 bcm of natural gas, end of 2024) and a hydroelectric potential of almost 4 GW. About 2/3 of the tropical forest (covering 60% of the surface area) is economically exploitable. The potential is estimated at 1.8 Mt.
Energy Use and Price by Sector
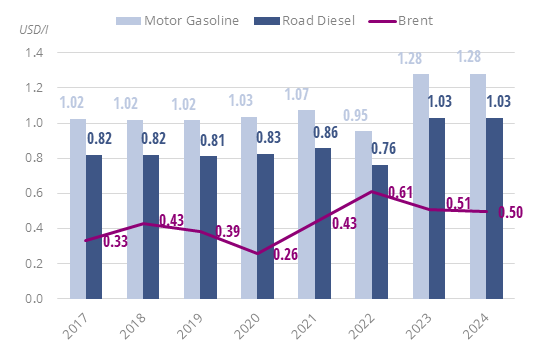
Energy Prices in Transport:
Motor fuel prices have slightly increased in 2025 at 1.33 USD/l for motor gasoline and 1.08UDS/l for road diesel. This followed a sharp increase of nearly 35% in 2022 and a stable period between 2023 and 2024.
Graph: Energy Prices in Transport (Taxes Included)
Issues & Prospects
Oil:
Congo aims to double its crude oil production to 500 kb/d by 2030 compared to 2022 (268 kb/d).
- Graph 1: Primary Consumption Trends by Energy Source
- Graph 2: Total Consumption Market Share by Energy (2024)
- Graph 3: Installed Electric Capacity by Source
- Graph 4: Installed Electric Capacity by Source (2024)
- Graph 5: Gross Power Production by Source & Consumption
- Graph 6: Power Generation by Source (2024)
- Graph 7: Crude Oil Production & Consumption
- Graph 8: Petroleum Products Production & Consumption
- Graph 9: Gas Production & Consumption
- Graph 10: Emissions of GHG and CO2 from Fuel Combustion
- Graph 11: Final Demand Trends by Energy Source
- Graph 12: Final Consumption by Sector
- Graph 13: Final Consumption Market Share by Sector (2024)
- Graph 14: Final Consumption in Industry by Energy Source
- Graph 15: Final Consumption in Transport by Energy Source
- Graph 16: Energy Prices in Transport (Taxes Included)
- Graph 17: Final Consumption in Residential, Services, Agriculture by Energy Source
- Graph 18: Upcoming New Capacity by Energy Source
- Economic Indicators: Annual historical data including population, GDP growth, imports and exports, inflation rate, energy security and efficiency indicators, CO2 emissions.
- Supply Indicators: Historical data including oil and gas reserves, electric and refining capacity, energy production, power production and external trade. All are detailed by energy source.
- Demand Indicators: Historical data including consumption per inhabitant, consumption trends, total consumption by energy source, final consumption by energy source and sector, and electricity consumption by sector.
- Energy Balances: Single table displaying the overall energy industry balance per annum, also graphically displayed by energy sub-segment.
The Congo energy market data since 1990 and up to
is included in the Excel file accompanying the Congo country report.
It showcases the historical evolution, allowing users to easily work with the data.
Key Data included in the excelsheet:
- Economic indicators: Annual historical economic indicators, energy security, energy efficiency and CO2 emissions.
- Supply indicators: Annual historical reserves, capacity, production and external trade (imports(+) exports(-) balance).
- Demand indicators: Annual historical consumption per capita, consumption trends, total consumption, final consumption (per energy and per sector) and electricity consumption total and per sector.
- Energy Balance: total and per energy.
- Congo Energy Prices: In addition to the analysis provided on the report we also provided a data set which includes historical details on the Congo energy prices for the follow items: price of premium gasoline (taxes incl.), price of diesel (taxes incl.), price of electricity in industry (taxes incl.), price of electricity for households (taxes incl.), price of natural gas in industry (taxes incl.), prices of natural gas for households (taxes incl.), spot price of Brent and CO2 emissions (from fuel combustion).