Canada Key Figures
- Population:
- 41.3 million
- GDP growth rate:
- 1.53 %/year
- Energy independence:
- 100%
Data of the last year available: 2024
- Total consumption/GDP:*
- 92.0 (2015=100)
- CO2 Emissions:
- 12.6 tCO2/cap
- Rate of T&D power losses:
- 5.46%
* at purchasing power parity
View all macro and energy indicators in the Canada energy report
Canada Energy News
View all news, archive your new and create your own daily newsletters only on your topics/countries of interest with Key Energy Intelligence
Canada Energy Research
- Canada's Energy & Climate Policy Framework: Canada aims to cut GHG emissions by 45-50% by 2035 and reach net-zero by 2050. Key policies include phasing out coal by 2030, promoting renewables, and implementing carbon pricing. Provincial governments play a significant role in energy regulation, with varying targets and strategies. Tensions exist between federal and provincial governments over resource exploitation and environmental policies.
- Canada's Energy Companies: Canada's energy sector is dominated by state-owned firms. Key players include Hydro-Québec, Ontario Power Generation, and BC Hydro in electricity; Suncor, CNR, and Cenovus in oil; and CNR, Ovintiv, and Peyto in gas. Major transmission and distribution networks are operated by Hydro-Québec, Hydro One, and Enbridge. The sector is undergoing significant transitions, including renewable energy expansion and pipeline infrastructure developments.
- Canada's Energy Supply & Demand: Canada's energy mix is dominated by hydrocarbons (75%), with gas and oil leading. CO2-free sources, primarily hydro (56%), account for 78% of electricity generation. Energy consumption remains stable at 302 Mtoe, with high per capita usage. Canada boasts significant energy resources, including substantial oil, gas, and hydro reserves. Electricity generation is largely hydro-powered, with notable contributions from gas and nuclear. Oil production has surged, driven by non-conventional sources, while gas production and exports are recovering. Coal use has declined sharply. Despite stable GHG emissions, Canada aims to reduce CO2 intensity, particularly in electricity generation.
- Canada's Energy Use & Price by Sector: Canada's final energy consumption has stabilised since 2022, with oil products as the primary source. Industry and residential sectors are the largest consumers, while electricity prices have recently decreased after prior increases. Transport demand has slightly declined, with biofuels gaining share. Regional price variations exist, notably in electricity costs.
- Canada's Issues & Prospects: By 2050, Canada aims to double electricity's share to 39%, reduce fossil fuel use by 56%, and phase out coal, replacing it with renewables and nuclear. Significant investments in wind, hydro, and transmission projects are underway, alongside advancements in carbon capture and green hydrogen initiatives.
Benefit from up to 2 000 up-to-date data series for 186 countries in Global Energy & CO2 data
A data overview is available in the global energy statistics app
Canada Total Energy Production & Consumption
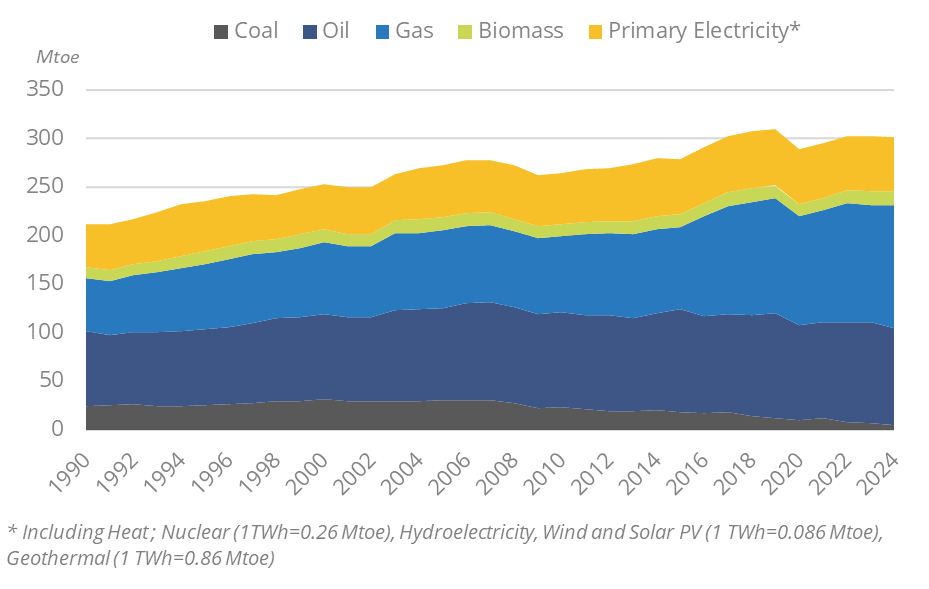
Total energy consumption stayed stable from 2022 to 2024, around 302 Mtoe, following a slight progression from 2010 to 2022 (1.1%/year on average at normal climate). At 7.3 toe, Canada's per capita energy consumption is among the highest in the world and almost triple the EU average (2024).
Graph: Primary Consumption Trends by Energy Source
Source: Canada energy report
Interactive Chart Canada Total Energy Production & Consumption
Source: Global Energy & CO2 data
Benefit from up to 2 000 up-to-date data series for 186 countries in Global Energy & CO2 data
View the detailed fondamentals of the market at country level (graphs, tables, analysis) in the Canada energy report
Canada Oil Production & Consumption
Oil production (crude, NGL, and non-conventional oil) increased by 4.4%/year since 2010, reaching 303 Mt in 2024 (+82%). It has more than doubled since 2000. This progression follows the development of non-conventional oil, which accounted for 62% of total oil production in 2024.
Source: Canada energy report
Interactive Chart Canada Crude Oil Production & Consumption
Source: Global Energy & CO2 data
Interactive Chart Canada Refined Oil Products Production & Consumption
Source: Global Energy & CO2 data
Benefit from up to 2 000 up-to-date data series for 186 countries in Global Energy & CO2 data
Additionally, for more detailed information on refineries, you can request a sample of our America Refineries Dataset
Canada Natural Gas Production & Consumption
Canada is the fifth largest natural gas producer in the world, after the United States, Russia, Iran, and China. Its production increased by 2.2%/year on average between 2010 and 2024 to 221 bcm (+ 2.7% in 2024). The production mainly comes from Alberta (70% of the total production).
Given the expansion of shale gas production in the US, Canadian gas exports, all of which go to the US, decreased rapidly between 2005 and 2020 (from 106 bcm to 73 bcm). They have risen again since then, reaching 91 bcm in 2024, close to 2010 level.
Source: Canada energy report
Interactive Chart Canada Gas Production & Consumption
Source: Global Energy & CO2 data
Benefit from up to 2 000 up-to-date data series for 186 countries in Global Energy & CO2 data
Additionally, for more detailed information on the LNG trade, you can request a sample of our America LNG Trade Dataset
Canada Coal and Lignite Production & Consumption
Coal and lignite production has been decreasing since its peak of 79 Mt in 1997 to 42 Mt in 2024. Production is concentrated in the western provinces: 90% of mines are located in British Columbia, Alberta, and Saskatchewan. An increasing share of production is exported (86% in 2024, + 30 pp since 2010), mostly coking coal.
Coal and lignite consumption has been decreasing rapidly since 2008 to 13 Mt in 2024 (-8%/year). Power generation absorbs 70% of consumption and 20% is used in industry.
Graph: Coal Production & Consumption
Source: Canada energy report
Interactive Chart Canada Coal and Lignite Production & Consumption
Source: Global Energy & CO2 data
Benefit from up to 2 000 up-to-date data series for 186 countries in Global Energy & CO2 data
View the detailed consumption trends at country level (graphs, tables, analysis) in the Canada energy report
Canada Renewable in % Electricity Production
There is no Federal target on renewables, but there is a target on carbon-free sources (90% of electricity in 2030). Each province has its own target on renewable development.
Source: Canada energy report
Interactive Chart Canada Share of Renewables in Electricity Production (incl hydro)
Source: Global Energy & CO2 data
Benefit from up to 2 000 up-to-date data series for 186 countries in Global Energy & CO2 data
Canada GHG emissions and CO2 emissions
In the 2025 NDC update, Canada pledged to reduce its GHG emissions by 45-50% below 2005 levels in 2035 (up from 40-45% by 2030 in the country's previous NDC of 2021). Canada is also committed to achieving net-zero GHG emissions by 2050.
Source: Canada energy report
Interactive Chart Canada CO2 emissions
Source: Global Energy & CO2 data
Benefit from up to 2 000 up-to-date data series for 186 countries in Global Energy & CO2 data
View the detailed consumption trends at country level (graphs, tables, analysis) in the Canada energy report