Business as unusual: latest 2020 energy consumption estimates
Get this executive brief in pdf format
This Executive Brief is an update of the ones we published in April and May, leveraging latest macro-economic assumptions and Enerdata energy statistics.
The Covid-19 pandemic that has struck since early 2020 has disrupted the global energy system. It represents a sudden break in the trend of increasing global energy consumption observed since the last global shock in 2009.
The containment measures put in place by the countries have had varying consequences on energy consumption depending on the measures implemented by the governments. Beyond the total lockdowns imposed on certain economic sectors, school closures and traffic restrictions also contributed to this reduction in activity, and consequently on energy consumption. Certain restrictions still in effect this summer continue to influence energy demand and the return to a level of activity similar to that of 2019, that is to say before the outbreak of the Covid-19 pandemic, is not considered for several years by international institutions.
Based on monthly data and economic parameters, we have developed a methodology to estimate the level of energy consumption for the year 2020. We give the main conclusions below for four indicators: final energy consumption, the consumption of the transport sector, the electricity mix and CO2 emissions related to the combustion of fossil fuels.
Methodology for estimating energy consumption for the full year 2020
To estimate the consequences of the Covid-19 pandemic on energy consumption and the resulting CO2 emissions, Enerdata has developed a mixed methodology based on economic projections from international institutions (mainly GDP) and on sectoral elasticities of energy consumption to GDP, which measure the change in consumption relative to the change in GDP. To take into account the exceptional situation of 2020, these elasticities were derived from historical values observed during periods of severe recession (2009 for most of the OECD countries). To consider travel constraints in the transport sector, the methodology combined a traffic reduction approach for both on road and air passenger transport, while an elasticity-based approach was preferred to estimate the freight traffic which was less constrained by lockdowns. The reduction in consumption linked to the confinement was based on the reductions in gasoline, diesel and jet fuel consumption observed during the months of confinement. The total energy consumption was calculated by adding to the final consumption the energy input for power generating and for other energy activities (refining, extraction, etc.). Fairly fine work was done to project the production of electricity and the electricity mix which was based on the data observed over the first 5 or 6 months of the year 2020 and a modelling of the mix on the rest of the year.
The estimates presented below have been calculated on the assumptions of the GDP evolution of the European Commission for European countries (July 2020), of the OECD for non-European countries belonging to the OECD (June 2020) and of the IMF for the other countries covered (June 2020).
Final energy consumption in free fall in all G20 countries except China
We find that, overall, variations in the final energy consumption of countries are strongly linked to the level of economic activity. Indeed, these two indicators evolve in parallel for all the countries studied. However, these evolutions vary in magnitude depending on the relative share of the economic sectors of each country, their integration into international trade and the containment measures put in place by the countries.
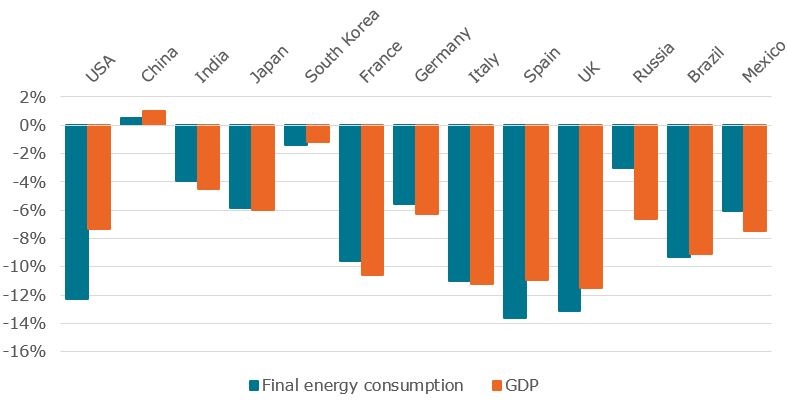
Figure 1 shows that only China is expected to show slightly positive variations in GDP (1%) and final energy consumption (0.5%) in 2020, although significantly lower than those of the past decade. This growth can be explained by the fact that for most of the Chinese provinces, the health crisis linked to the Covid-19 epidemic peaked between January 23rd and February 10th, which was the period of New Year holidays in China, a period of usually lower activity for Chinese industry which represents more than 50% of the final energy consumption of the country. The containment and quarantine measures implemented from the end of January, which have weighed on the transport of goods and logistics in February and March and had thus affected the supply chain of certain industries, had overall relatively low impact compared to the economic activity level that the country is usually experiencing at this time of year.
Figure 1 : Estimated final energy consumption and GDP variations in 2020 in major G20 countries (%)
Source: Enerdata
All the other G20 countries show sharp declines in GDP and energy consumption. The United States and Europe are among the most affected areas. The United States, whose measures to fight the pandemic were relatively late, records a final energy consumption reduction greatly exceeding that of its GDP due to the sharp fall in demand in the transport sector, which represents 40% of the country's final energy consumption. This trend is verified both for road and air transports (Figure 2). Although the strength of the economic recovery is not yet known, we estimate that given the current containment measures, final energy consumption in the United States is expected to contract by 12%.
Figure 2: Monthly jet fuel aviation consumption in the USA (Mt)
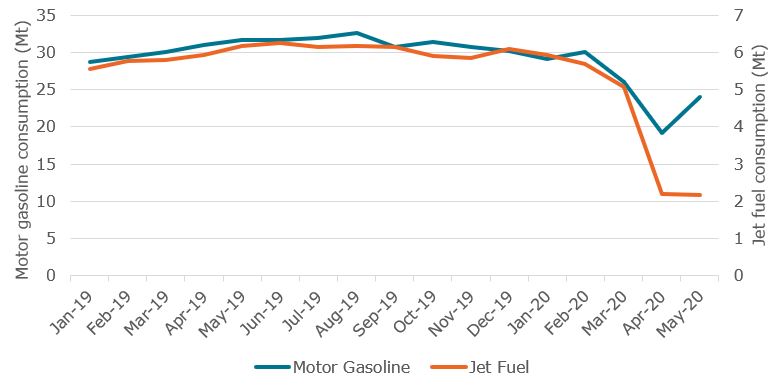
Motor gasoline (left axis) is consumed on the road transport, while jet fuel (right axis) is consumed in air transport.
Source: Enerdata from US EIA
In Europe, we are seeing a reduction in final energy consumption in all sectors except the residential sector. This is a combined effect of the containment measures which have constrained industrial production, severely restricted traffic, and reduced the availability of workers. We believe that the reduction in final energy demand should be around 8% in Europe including 13.5% in Spain, 11% in Italy, 9.5% in France and 5.5% in Germany, while the United Kingdom will see its consumption fall by 13%. Germany is recording a smaller drop in consumption thanks to less restrictive containment than its neighbours and a resilient industrial sector with a high relative share in GDP. In contrast, the southern European countries of Italy, Spain and France have put in place measures which have severely constrained travel that has severely hit the tourism sector that represent a significant share of GDP for these countries.
In Europe, as in many countries, energy demand in the residential sector is rising slightly due to the increased presence of inhabitants in their homes due to mandatory home confinements. This increase is however contained by exceptionally warm temperatures during winter 2020 (Figure 3), particularly in the northern hemisphere, which leads to lower energy consumption for heating purpose. Without this temperature effect, the reduction in energy consumption would have been even greater.
Figure 3: Twelve-month average surface air temperature anomalies (degree, C°)
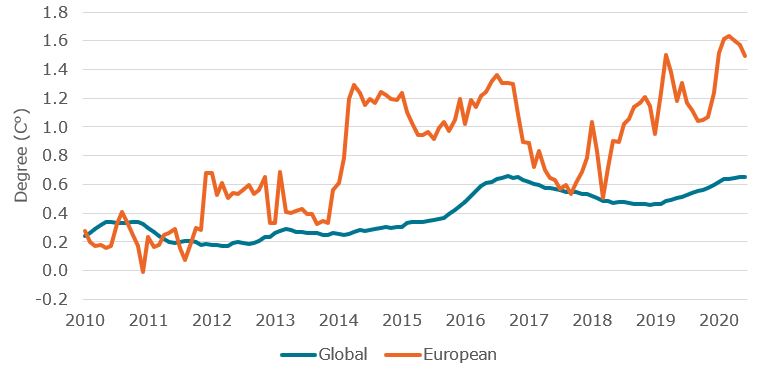
Source: Enerdata from Copernicus Climate Change Service
Intermittent renewable technologies are gaining market share
The drop in final energy consumption mentioned above also had the effect of significantly changing the electricity mix in favour of renewable energies. Indeed, these technologies, enjoying priority access to the grid due to low operating costs, have seen their relative share jump because of the drop in consumption and therefore in power generation. We estimate that over the whole of 2020 the production of electricity from solar and wind power will increase sharply in almost all countries: by 14% in the United States, 13% in China and Japan each, and by 10% in Europe (Figure 4).
Figure 4: Estimated evolution of total and wind+solar power generation in major G20 countries in 2020 (%)
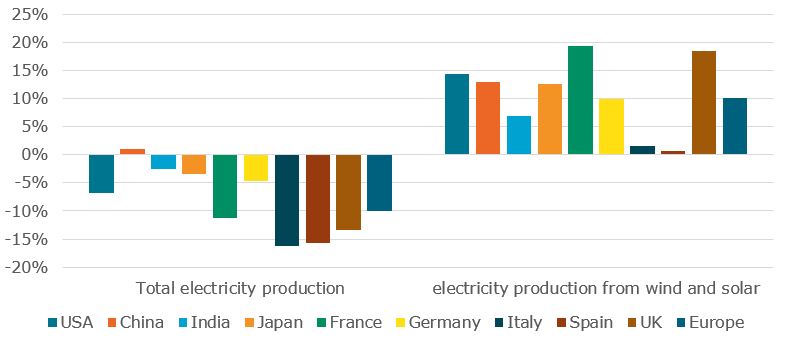
Source: Enerdata
Consequently, except in China, the production of electricity from fossil fuels is largely driven out of the electricity mix, despite a very sharp drop in gas prices on international markets due to the excess gas supply. Apart from China, which continues to use coal extensively as an input in power plants, the covid-19 pandemic will have helped accelerate the phase-out of coal in many countries.
Falling energy-related CO2 emissions
The overall decrease in energy consumption combined with the strong progress of renewable technologies has led to a significant reduction in energy-related CO2 emissions of around 8% for the G20 and 9% for the entire globe (Figure 5). Such a contraction corresponds to bringing World emissions back to their 2010 level.
Figure 5: Estimated world primary energy supply and energy-related CO2 emissions variations in 2020 (%)
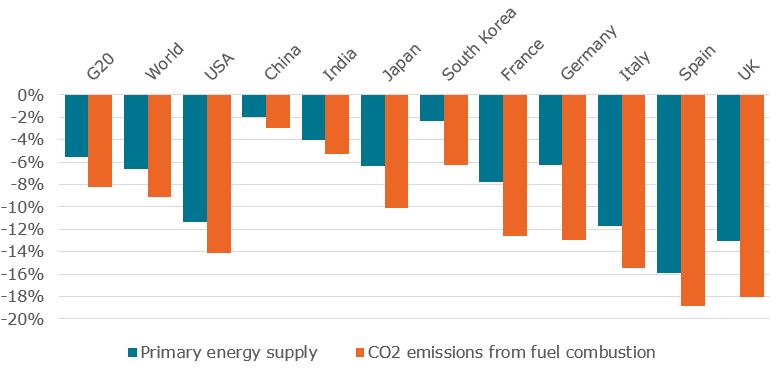
Source: Enerdata
Key Takeaways (estimates for year 2020):
- Energy demand trends are still strongly correlated with those of GDP at world level, with some country-level discrepancies
- China’s GDP will be the less affected relatively, China being the only large country showing a growth, albeit small (+1%)
- Energy consumption is to drop by 12% in the US, by 8% in Europe, and to grow by a mere 0.5% in China
- The share of renewables in power generation will be significantly increasing due to their operating cost competitiveness in a lower electricity consumption context
- Consequently, CO2 emissions are to drop by 9% globally