According to a new report of the REN21, 2012 was another record year in terms of renewable power generation capacity, with 115 GW of new renewables installed worldwide, equivalent to just over half of total net additions. Total renewable power capacity worldwide exceeded 1,470 GW in 2012, up 8.5% from 2011. Wind power accounted for about 39% of renewable power capacity added followed by hydropower and solar PV, which each accounted for approximately 26%. Solar PV capacity reached the 100 GW milestone, surpassing bio-power to become the third largest renewable technology in terms of capacity in operation, after hydro and wind.
In the lead is China, which in 2012 consolidated its position as the world’s dominant renewable energy market player—up 22%, an equivalent of US$67bn, thanks largely to a jump in solar investment. Elsewhere there were particularly sharp increases in South Africa, Morocco, Mexico, Chile and Kenya, with Middle East and Africa showing the highest regional growth of 228% to US$12bn.
With US$244bn (including small hydro-electric projects), 2012 was the second highest year ever for renewable energy investments. There was a continuing upward trend in developing countries, with investments in the South topping US$112bn versus US$132bn in developed countries—a dramatic change from 2007, when developed economies invested 2.5 times more in renewables (excluding large hydro) than developing countries. The gap has now closed to just 18%.
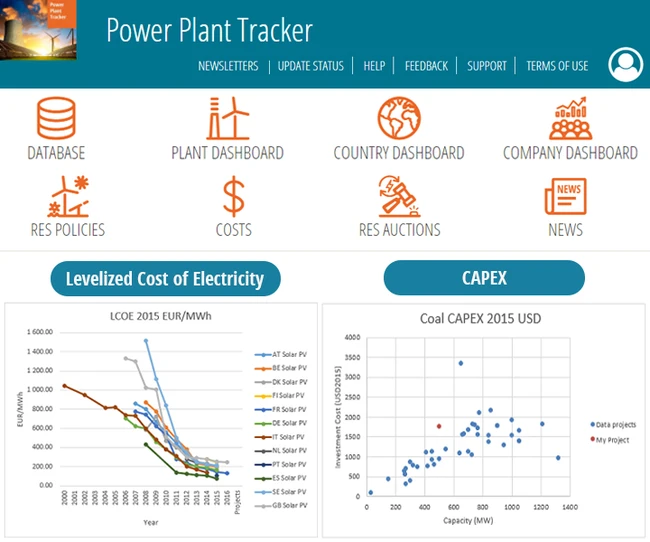
Searching for proven generation costs?
Then CAPEX & LCOE is the database you need. The module provides exclusive insights on both Capital Expenditure and Levelised Cost of Electricity.
Make informed decisions in terms of which technologies to invest in and where. In just a few clicks, access unique, premium data on both thermal and renewable power generation costs by technology and by country. Put our detailed, reliable information to use and benchmark your project.