Uzbekistan Key Figures
- Population:
- 36.4 million
- GDP growth rate:
- 6.50 %/year
- Energy independence:
- 81.8%
Data of the last year available: 2024
- Total consumption/GDP:*
- 74.0 (2015=100)
- CO2 Emissions:
- 3.27 tCO2/cap
- Rate of T&D power losses:
- 12.1%
* at purchasing power parity
View all macro and energy indicators in the Uzbekistan energy report
Uzbekistan Energy News
View all news, archive your new and create your own daily newsletters only on your topics/countries of interest with Key Energy Intelligence
Uzbekistan Energy Research
- Uzbekistan's Energy & Climate Policy Framework: Uzbekistan aims to boost renewable energy capacity to 27 GW by 2030, halving GHG intensity by 2035. Key policies include electricity market reforms, nuclear development, and energy efficiency measures, supported by new laws and agencies.
- Uzbekistan's Energy Companies: Uzbekistan's energy sector includes state-owned companies like JSC "Thermal Power Plants" (70% capacity), Uzbekneftegaz (oil & gas), and UzbekHydroEnergo (hydropower). Uzbekenergo was unbundled in 2019, creating separate entities for generation, transmission, and distribution. Privatisation efforts are ongoing, with partial sales in power and uranium sectors. Foreign investors like Lukoil and Gazprom are active in gas production.
- Uzbekistan's Energy Supply & Demand: Uzbekistan's energy mix is dominated by natural gas (80% of consumption), with rising uranium production and increasing renewable energy capacity. Energy demand has grown by 4% annually since 2022, driven by industrial and household sectors. The country aims to double uranium output by 2030.
- Uzbekistan's Energy Use & Price by Sector: In 2024, buildings accounted for 54% of final energy consumption, with gas being the dominant fuel. Energy prices have risen significantly, particularly for industry and transport, though residential electricity remains subsidised.
- Uzbekistan's Issues & Prospects: Uzbekistan is expanding its energy sector with significant investments in renewables, nuclear, and gas projects, aiming for 30 GW of power capacity by 2030, with renewables targeting 25% of the mix. Key initiatives include nuclear power plants, solar and wind projects, and gas infrastructure developments, supported by international partnerships.
Benefit from up to 2 000 up-to-date data series for 186 countries in Global Energy & CO2 data
A data overview is available in the global energy statistics app
Uzbekistan Total Energy Production & Consumption
Primary energy consumption has been rising by 4%/year since 2022, reaching 52 Mtoein 2024. It has ranged between 43 and 50 Mtoe since 2010. Total energy consumption per capita is about 1.4 toe, which is 63% below the CIS average. Its energy intensity is 17% lower than the CIS average (42% above the global average) but is falling more rapidly (-3.7%/year since 2014).
Gas represents most of the country's total energy consumption with 80% (-6 pp since 2010), followed by oil with 9% (stable since 2010), coal and lignite with 9% (+6 pp since 2010), and hydropower with 1.6% (2024).
Source: Uzbekistan energy report
Interactive Chart Uzbekistan Total Energy Production & Consumption
Source: Global Energy & CO2 data
Benefit from up to 2 000 up-to-date data series for 186 countries in Global Energy & CO2 data
View the detailed fondamentals of the market at country level (graphs, tables, analysis) in the Uzbekistan energy report
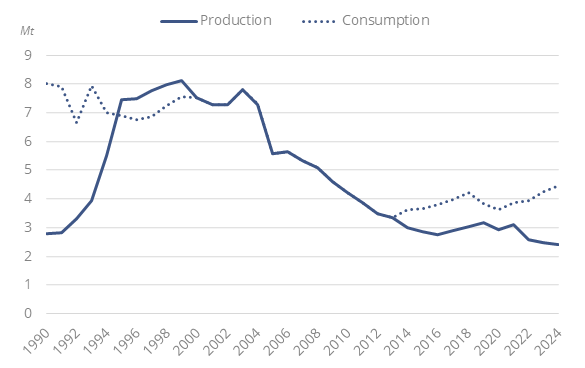
Uzbekistan Oil Production & Consumption
Oil production has stabilised at around 2.5 Mt/year since 2022 (2.4 Mt in 2024), after halving between 2005 and 2016 (from 5.6 Mt to 2.7 Mt). Since 2017, Uzbekistan can import Russian oil through the 12 Mt/year Omsk-Pavlodar-Shymkent pipeline.
Graph: Crude Oil Production & Consumption
Source: Uzbekistan energy report
Interactive Chart Uzbekistan Crude Oil Production & Consumption
Source: Global Energy & CO2 data
Interactive Chart Uzbekistan Refined Oil Products Production & Consumption
Source: Global Energy & CO2 data
Benefit from up to 2 000 up-to-date data series for 186 countries in Global Energy & CO2 data
Additionally, for more detailed information on refineries, you can request a sample of our EMEA Refineries Dataset
Uzbekistan Natural Gas Production & Consumption
The production of gas has been declining by about 2.7%/year since 2008 (-5%/year since 2021), reaching 45 bcm in 2024. According to preliminary estimates, it averaged 42 bcmin 2025. Gas is processed in five plants (two of which were commissioned in 2018): one in Mubarek (24 bcm/year), two in Shurtan (20 bcm/year), one in Kandym, and one in Gissar. Lukoil has commissioned two new processing plants, the US$3.4bn Kandym Gas Processing Complex (KGPC) in the Bukhara province and a second one at the Dzharkuduk field.
Source: Uzbekistan energy report
Interactive Chart Uzbekistan Gas Production & Consumption
Source: Global Energy & CO2 data
Benefit from up to 2 000 up-to-date data series for 186 countries in Global Energy & CO2 data
Additionally, for more detailed information on the LNG trade, you can request a sample of our EMEA LNG Trade Dataset
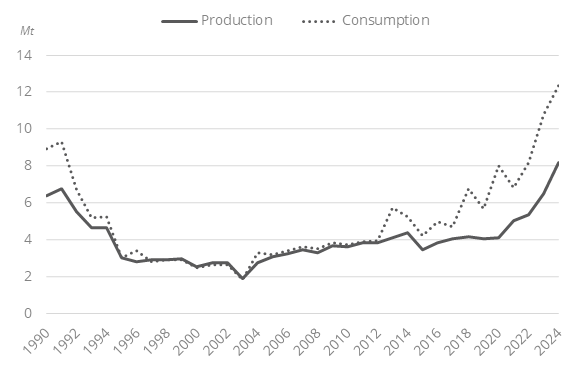
Uzbekistan Coal and Lignite Production & Consumption
Coal and lignite production has increased fourfold since its record low of 2003 (1.9 Mt), accelerating since 2020, with a 25% surge to 8.2 Mt in 2024 (around 95% of which is lignite). According to preliminary estimates, coal production rose to 8.9 Mt in 2025. Production covers two thirds of consumption, and the remainder is imported.
Graph: Coal Production & Consumption
Source: Uzbekistan energy report
Interactive Chart Uzbekistan Coal and Lignite Production & Consumption
Source: Global Energy & CO2 data
Benefit from up to 2 000 up-to-date data series for 186 countries in Global Energy & CO2 data
View the detailed consumption trends at country level (graphs, tables, analysis) in the Uzbekistan energy report
Uzbekistan Renewable in % Electricity Production
In 2024, Uzbekistan approved new targets to reach 27 GW of renewable capacity and 40% of renewable power generation in 2030, to enable a 34 MtCO2 cut in emissions.
Source: Uzbekistan energy report
Interactive Chart Uzbekistan Share of Renewables in Electricity Production (incl hydro)
Source: Global Energy & CO2 data
Benefit from up to 2 000 up-to-date data series for 186 countries in Global Energy & CO2 data
Uzbekistan GHG emissions and CO2 emissions
A Climate Council was set up in 2024 to monitor national commitments vs. the UNFCCC, and a law on "limiting GHG emissions" was adopted in 2025. In July 2025, Uzbekistan also enacted a carbon emissions law establishing a market-based trading system for carbon units(1 unit = 1 t-CO2e), effective 1 January 2026, with up to 80% of credits eligible for international sales pending Ministry of Economy and Finance approval.
Source: Uzbekistan energy report
Interactive Chart Uzbekistan CO2 emissions
Source: Global Energy & CO2 data
Benefit from up to 2 000 up-to-date data series for 186 countries in Global Energy & CO2 data
View the detailed consumption trends at country level (graphs, tables, analysis) in the Uzbekistan energy report