Oman Key Figures
- Population:
- 4.64 million
- GDP growth rate:
- 1.30 %/year
- Energy independence:
- 100%
Data of the last year available: 2023
- Total consumption/GDP:*
- 169 (2005=100)
- CO2 Emissions:
- 16.5 tCO2/capita
- Rate of T&D power losses:
- 8.66%
* at purchasing power parity
View all macro and energy indicators in the Oman energy report
Oman Energy News
View all news, archive your new and create your own daily newsletters only on your topics/countries of interest with Key Energy Intelligence
Oman Energy Research
Benefit from up to 2 000 up-to-date data series for 186 countries in Global Energy & CO2 data
A data overview is available in the global energy statistics app
Oman Total Energy Production & Consumption
Total consumption of energy per capita amounts to 6.9 toe (2023), i.e. three times higher than the global average. Per capita electricity consumption reached 8.5 MWh in 2023.
Graph: CONSUMPTION TRENDS BY ENERGY SOURCE (Mtoe)
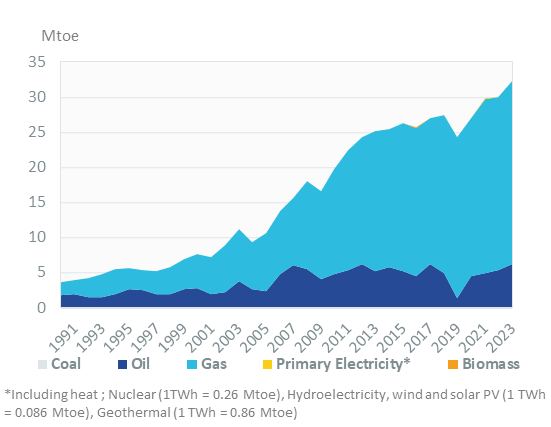
Source: Oman energy report
Interactive Chart Oman Total Energy Production & Consumption
Source: Global Energy & CO2 data
Benefit from up to 2 000 up-to-date data series for 186 countries in Global Energy & CO2 data
View the detailed fondamentals of the market at country level (graphs, tables, analysis) in the Oman energy report
Oman Oil Production & Consumption
Oil production decreased by 1.5% in 2023 to 52.3Mt, following an 11% increase in 2022; it remained roughly stable between 2017. It increased rapidly from 2007 to 2016 (3.7%/year) as a result of enhanced oil recovery techniques and the development of new fields, in particular Western Bukhad and Makhaizna. From 2000 to 2007, oil production declined due to maturing oil fields, dropping from a peak of48 Mt in 2001 to 35 Mt.
Source: Oman energy report
Interactive Chart Oman Crude Oil Production & Consumption
Source: Global Energy & CO2 data
Interactive Chart Oman Refined Oil Products Production & Consumption
Source: Global Energy & CO2 data
Benefit from up to 2 000 up-to-date data series for 186 countries in Global Energy & CO2 data
Additionally, for more detailed information on refineries, you can request a sample of our EMEA Refineries Dataset
Oman Natural Gas Production & Consumption
The production of natural gas has increased regularly by almost 4%/year since 2010, reaching 46.7 bcm in 2023 (i.e. almost 5 times the level of 2 000).
Production from the Ghazeer gas field in Block 61 started in 2020 (15.5 bcm/year of gas and over 65 kb/d of condensates). It will double production from Block 61 where the Khazzan gas field is already producing 15.5 bcm/year. Block 61 holds the largest tight gas reserve in the Middle East.
The country has a network of about 4 200 km of high-pressure gas transmission pipelines.
Source: Oman energy report
Interactive Chart Oman Gas Production & Consumption
Source: Global Energy & CO2 data
Benefit from up to 2 000 up-to-date data series for 186 countries in Global Energy & CO2 data
Additionally, for more detailed information on the LNG trade, you can request a sample of our EMEA LNG Trade Dataset
Oman Renewable in % Electricity Production
According to NPWP's 7-year statement (2023-2029), Oman aims to reach 30% of renewables in power generation by 2030 (1% in 2023).
Source: Oman energy report
Interactive Chart Oman Share of Renewables in Electricity Production (incl hydro)
Source: Global Energy & CO2 data
Benefit from up to 2 000 up-to-date data series for 186 countries in Global Energy & CO2 data
Oman GHG emissions and CO2 emissions
In its second NDC (2021), Oman set an unconditional GHG emission reduction target of 4% and a conditional reduction target up to 7% of the BAU scenario by 2030. Under its BAU scenario, Oman estimates GHG emissions at around 125 MtCO2eq by 2030; the 7% cut would limit GHG emissions to 116 MtCO2eq (up from 2% in its first NDC in 2019).
The Ministry of Energy and Minerals has announced net-zero emissions by 2050.
Source: Oman energy report
Interactive Chart Oman CO2 emissions
Source: Global Energy & CO2 data
Benefit from up to 2 000 up-to-date data series for 186 countries in Global Energy & CO2 data
View the detailed consumption trends at country level (graphs, tables, analysis) in the Oman energy report