Oman Key Figures
- Population:
- 5.28 million
- GDP growth rate:
- 1.67 %/year
- Energy independence:
- 100%
Data of the last year available: 2024
- Total consumption/GDP:*
- 107 (2015=100)
- CO2 Emissions:
- 14.6 tCO2/cap
- Rate of T&D power losses:
- 9.50%
* at purchasing power parity
View all macro and energy indicators in the Oman energy report
Oman Energy News
View all news, archive your new and create your own daily newsletters only on your topics/countries of interest with Key Energy Intelligence
Oman Energy Research
- Oman's Energy & Climate Policy Framework: Oman aims to reduce GHG emissions by 7% and increase renewables to 30% by 2030, while transitioning from hydrocarbons. The Ministry of Energy and Minerals oversees this shift, including green hydrogen production. Electricity regulation is managed by APSR, with privatisation efforts underway. The country also targets net-zero emissions by 2050.
- Oman's Energy Companies: Oman's energy sector is dominated by private companies, with Engie Stomo and Mitsui/ACWA Power leading electricity generation. Key players in oil production include PDO, Occidental, and Petrogas, while gas is supplied by PDO, BP, and Oman LNG. Transmission and distribution are managed by state-linked entities like OETC and Nama.
- Oman's Energy Supply & Demand: Oman's energy supply, dominated by natural gas (87%), has grown by 6% annually since 2019, with buildings consuming 80% of electricity. Oil and gas reserves are substantial, while solar capacity is expanding. Electricity production, primarily from gas, increased by 6% in 2023 and 9% in 2024, with consumption rising by 7% annually. GHG emissions have grown steadily, driven by fuel combustion.
- Oman's Energy Use & Price by Sector: "Oman's energy demand is rising rapidly, driven by industrial and service sectors, with gas as the dominant fuel. Prices for oil and electricity have stabilised post-2022, though they remain high compared to regional peers."
- Oman's Issues & Prospects: Oman is expanding its energy sector with significant gas, solar, and wind projects, including green hydrogen initiatives. Peak electricity demand is projected to rise to 13 GW by 2029, with substantial investments in transmission infrastructure and GCC interconnections. Oil and gas production are also set to increase, alongside LNG and green hydrogen developments.
Benefit from up to 2 000 up-to-date data series for 186 countries in Global Energy & CO2 data
A data overview is available in the global energy statistics app
Oman Total Energy Production & Consumption
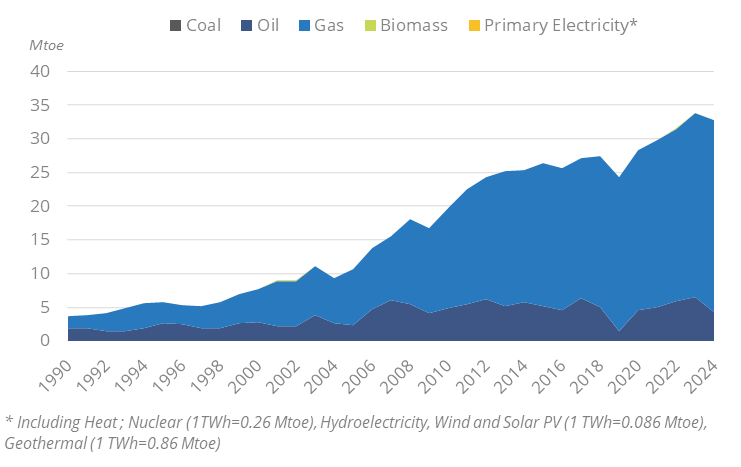
Total energy supply has been growing by 6%/year since 2019 to 33 Mtoe. This is equivalent to 6.2 toe per capita, three times the global average. The energy mix is dominated by natural gas (87%), while oil covers 13%. The consumption grew much slower from 2013 to 2018 (1.6%/year) and dropped by 10% in 2019.
Graph: Primary Consumption Trends by Energy Source
Graph: Total Consumption Market Share by Energy (2024)
Source: Oman energy report
Interactive Chart Oman Total Energy Production & Consumption
Source: Global Energy & CO2 data
Benefit from up to 2 000 up-to-date data series for 186 countries in Global Energy & CO2 data
View the detailed fondamentals of the market at country level (graphs, tables, analysis) in the Oman energy report
Oman Oil Production & Consumption
Oil production decreased by 5% in 2024 to 50 Mt, following a 10% increase in 2022; it remained roughly stable between 2017. It increased rapidly from 2007 to 2016 (4%/year) as a result of enhanced oil recovery techniques and the development of new fields, in particular Western Bukhad and Makhaizna. From 2000 to 2007, oil production declined due to maturing oil fields, dropping from a peak of 48 Mt in 2001 to 35 Mt.
Source: Oman energy report
Interactive Chart Oman Crude Oil Production & Consumption
Source: Global Energy & CO2 data
Interactive Chart Oman Refined Oil Products Production & Consumption
Source: Global Energy & CO2 data
Benefit from up to 2 000 up-to-date data series for 186 countries in Global Energy & CO2 data
Additionally, for more detailed information on refineries, you can request a sample of our EMEA Refineries Dataset
Oman Natural Gas Production & Consumption
The production of natural gas has increased regularly by almost 4%/year since 2010, reaching 58 bcm in 2024 (i.e. almost 6 times the level of 2 000).
Production from the Ghazeer gas field in Block 61 started in 2020 (15.5 bcm/year of gas and over 65 kb/d of condensates). It will double production from Block 61 where the Khazzan gas field is already producing 15.5 bcm/year. Block 61 holds the largest tight gas reserve in the Middle East.
The country has a network of about 4 200 km of high-pressure gas transmission pipelines.
Source: Oman energy report
Interactive Chart Oman Gas Production & Consumption
Source: Global Energy & CO2 data
Benefit from up to 2 000 up-to-date data series for 186 countries in Global Energy & CO2 data
Additionally, for more detailed information on the LNG trade, you can request a sample of our EMEA LNG Trade Dataset
Oman Renewable in % Electricity Production
According to NPWP's 7-year statement (2023-2029), Oman aims to reach 30% of renewables in power generation by 2030 (3% in 2024).
Source: Oman energy report
Interactive Chart Oman Share of Renewables in Electricity Production (incl hydro)
Source: Global Energy & CO2 data
Benefit from up to 2 000 up-to-date data series for 186 countries in Global Energy & CO2 data
Oman GHG emissions and CO2 emissions
In 2023, Oman updated its second NDC, setting an unconditional GHG emission reduction target of 7% and a conditional reduction target up to 21% of the BAU scenario by 2030. Under its BAU scenario, Oman estimates GHG emissions at around 107 MtCO2eq by 2030; the 7% cut would limit GHG emissions to 100 MtCO2eq. The bulk of the reduction would be achieved by cutting emissions from the power sector by 42% of BAU in 2030.
The Ministry of Energy and Minerals has announced net-zero emissions by 2050.
Source: Oman energy report
Interactive Chart Oman CO2 emissions
Source: Global Energy & CO2 data
Benefit from up to 2 000 up-to-date data series for 186 countries in Global Energy & CO2 data
View the detailed consumption trends at country level (graphs, tables, analysis) in the Oman energy report