Malaysia Key Figures
- Population:
- 35.6 million
- GDP growth rate:
- 5.11 %/year
- Energy independence:
- 96.8%
Data of the last year available: 2024
- Total consumption/GDP:*
- 66.7 (2005=100)
- CO2 Emissions:
- 6.87 tCO2/capita
- Rate of T&D power losses:
- 6.12%
* at purchasing power parity
View all macro and energy indicators in the Malaysia energy report
Malaysia Energy News
View all news, archive your new and create your own daily newsletters only on your topics/countries of interest with Key Energy Intelligence
Malaysia Energy Research
Benefit from up to 2 000 up-to-date data series for 186 countries in Global Energy & CO2 data
A data overview is available in the global energy statistics app
Malaysia Total Energy Production & Consumption
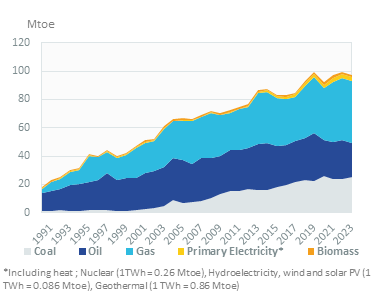
In 2024, consumption per capita was 2.8 toe. This is higher than neighbouring countries. Electricity consumption per capita reached 5 084 kWh in 2024.
Graph: CONSUMPTION TRENDS BY ENERGY SOURCE (Mtoe)
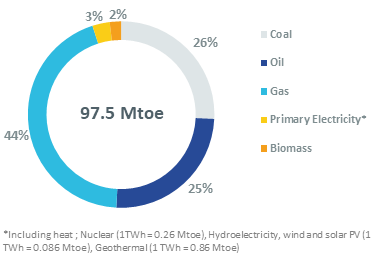
Graph: TOTAL CONSUMPTION MARKET SHARE BY ENERGY (2024, %)
Source: Malaysia energy report
Interactive Chart Malaysia Total Energy Production & Consumption
Source: Global Energy & CO2 data
Benefit from up to 2 000 up-to-date data series for 186 countries in Global Energy & CO2 data
View the detailed fondamentals of the market at country level (graphs, tables, analysis) in the Malaysia energy report
Malaysia Oil Production & Consumption
Oil production has decreased by 2.4%/year since 2010, reaching 24 Mt in 2024. Previously, it remained roughly stable over 2000-2010 at around 33 Mt.
Source: Malaysia energy report
Interactive Chart Malaysia Crude Oil Production & Consumption
Source: Global Energy & CO2 data
Interactive Chart Malaysia Refined Oil Products Production & Consumption
Source: Global Energy & CO2 data
Benefit from up to 2 000 up-to-date data series for 186 countries in Global Energy & CO2 data
Additionally, for more detailed information on refineries, you can request a sample of our Asia Refineries Dataset
Malaysia Natural Gas Production & Consumption
Natural gas production increased by around 4%/year between 2020 and 2024, reaching 80 bcm in 2024, in line with the progression over 2010-2019; it decreased by 10% in 2020 due to the contraction of gas demand induced by the COVID-19 pandemic.
Source: Malaysia energy report
Interactive Chart Malaysia Gas Production & Consumption
Source: Global Energy & CO2 data
Benefit from up to 2 000 up-to-date data series for 186 countries in Global Energy & CO2 data
Additionally, for more detailed information on the LNG trade, you can request a sample of our Asia LNG Trade Dataset
Malaysia Renewable in % Electricity Production
SEDA, the Sustainable Energy Development Authority, was set up in 2011 for checking that sustainable energy programmes are properly managed and for assessing and fostering new sustainable energy solutions.
The 11th Malaysian Plan (2016-2020) goal of reaching 2 GW of renewable capacity in 2020 (large hydro excluded, i.e. >100 MW) was fulfilled as it exceeded 3 GW.
Source: Malaysia energy report
Interactive Chart Malaysia Share of Renewables in Electricity Production (incl hydro)
Source: Global Energy & CO2 data
Benefit from up to 2 000 up-to-date data series for 186 countries in Global Energy & CO2 data
Learn more about renewables in the Mini grid Africa & Asia markets for village electrification
Malaysia GHG emissions and CO2 emissions
In 2021, the country updated its first NDC, pledging to unconditionally reduce its GHG intensity of GDP by 45% in 2030 relative to 2005 (compared to 35% unconditional and 10% conditional, previously).
GHG emissions reached nearly 326 Mt CO2eq in 2021, according to Malaysia's Department of Statistics (LULUCF excluded). In 2019, LULUCF represented a removal of 215 Mt CO2eq, out of total emissions of 330 Mt CO2eq, implying net emissions (i.e. LULUCF included) of 115 Mt CO2eq.
Source: Malaysia energy report
Interactive Chart Malaysia CO2 emissions
Source: Global Energy & CO2 data
Benefit from up to 2 000 up-to-date data series for 186 countries in Global Energy & CO2 data
View the detailed consumption trends at country level (graphs, tables, analysis) in the Malaysia energy report