
- Update
-
- Format
- 4 files (PDF report, 3 Excel files)
- Pages
-
37 (Report only)
- Delivery
- Immediate by e-mail
- GENERAL OVERVIEW
- INSTITUTIONS AND ENERGY POLICY
- ENERGY COMPANIES
- ENERGY SUPPLY
- ENERGY PRICES
- ENERGY CONSUMPTION
- ISSUES AND PROSPECTS
- DATA TABLES
- ABBREVIATIONS
- GLOSSARY
Buy Malaysia energy report
Price without VAT. Depending on your status and location, VAT might be applicable. Get in touch with us for more information.
After validation, you will immediately receive 4 files by email (one pdf report and 3 excel files containing the datasets).
Overview
This analysis includes a comprehensive Malaysia energy market report and updated datasets. It is derived from the most recent key economic indicators, supply and demand factors, oil and gas pricing trends and major energy issues and developments surrounding the energy industry. The report provides a complete picture of the country situation, dynamics, current issues and future prospects. With market data and continuous follow-up of markets news, this report brings clear and concise insights with which to tackle national energy challenges and opportunities. Browse the tabs below for a detailed table of contents, the list of graphs and tables, and details on the data files.
Highlights
- The GHG emissions intensity is planned to be reduced by 45% in 2030.
- For renewables, the country targets a 40% share in the power capacity mix in 2035 and a 17% share in the energy mix in 2040.
- Two public companies dominate the energy sector: TNB for electricity and Petronas for oil and gas.
- The share of renewables in the power mix has increased by 13.5 points since 2010 to 20% in 2024.
- Thermal generation is shared between coal (47%) and gas (34%).
- Diesel price increased by 25% following the removal of subsidies. Gasoline and diesel are much cheaper than in the most developed Asian countries.
- Electricity prices for households have decreased by 40% since 2020.
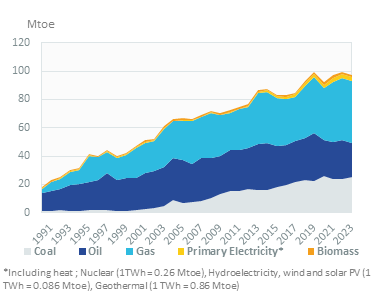
- Total energy consumption has been increasing by 3%/year since 2020.
- Oil and gas represent around 70% of total consumption.
- Electricity consumption is growing by about 4%/year since 2020.
- The National Energy Plan 2022-2040 aims to reduce the share of coal in the power capacity mix from 31% in 2018 to 18.6% in 2040.
- Petronas is partnering with various companies to explore the potential and viability of CCS technology, making Malaysia a key CCS hub in the ASEAN region.
Institutions & Energy Policy
The Economic Planning Unit (EPU), a planning body under the supervision of the Prime Minister, drafts the country's energy policy through its energy division (Energy Section). Decisions are taken by a restricted council of ministers, the "Cabinet Committee on Energy".
Energy Companies
Oil:
Petronas is involved in exploration-production activities through its subsidiary Petronas Carigali. Petronas' global assets produced 813 kboe/d of crude oil and condensates in 2024 (-4% compared to 2023) through overseas exploration activities in more than 20 countries.
Energy Supply
Gas:
Natural gas production increased by around 4%/year between 2020 and 2024, reaching 80 bcm in 2024, in line with the progression over 2010-2019; it decreased by 10% in 2020 due to the contraction of gas demand induced by the COVID-19 pandemic.
Energy Prices
Electricity:
Electricity prices for households have been decreasing very rapidly since 2020 by 13%/year, reaching US$4.8c/kWh in 2024, i.e. a level 40% lower than in 2020.
Electricity prices for industries peaked in 2020 up to US$8.1c/kWh, before dropping by 2%/year to US$7.4c/kWh in 2024.
Energy Consumption
In 2024, consumption per capita was 2.8 toe. This is higher than neighbouring countries. Electricity consumption per capita reached 5 084 kWh in 2024.
Graph: CONSUMPTION TRENDS BY ENERGY SOURCE (Mtoe)
Graph: TOTAL CONSUMPTION MARKET SHARE BY ENERGY (2024, %)
Issues & Prospects
Electricity:
The NEP 2022-2040 targets 18.4 GW of renewable capacity (including hydro) in 2040 and a reduction in the share of coal in the capacity mix from 31% in 2018 to 18.6% in 2040.
- GRAPH 1: CO2-energy emissions (MtCO2)
- GRAPH 2: Installed electric capacity by source (2024, %)
- GRAPH 3: Gross power production by source (TWh)
- GRAPH 4: Power generation by source (2024, %)
- GRAPH 5: Gasoline & diesel prices (US$/l)
- GRAPH 6: Electricity prices for industry and households (US$c/kWh)
- GRAPH 7: Consumption trends by energy source (Mtoe)
- GRAPH 8: Total consumption market share by energy (2024, %)
- GRAPH 9: Final consumption market share by sector (2024, %)
- Economic Indicators: Annual historical data including population, GDP growth, imports and exports, inflation rate, energy security and efficiency indicators, CO2 emissions.
- Supply Indicators: Historical data including oil and gas reserves, electric and refining capacity, energy production, power production and external trade. All are detailed by energy source.
- Demand Indicators: Historical data including consumption per inhabitant, consumption trends, total consumption by energy source, final consumption by energy source and sector, and electricity consumption by sector.
- Energy Balances: Single table displaying the overall energy industry balance per annum, also graphically displayed by energy sub-segment.
- Infrastructure Projects: Covers power plant projects by energy, technology, status and operator.
The Malaysia energy market data since 1990 and up to
is included in the Excel file accompanying the Malaysia country report.
It showcases the historical evolution, allowing users to easily work with the data.
Key Data included in the excelsheet:
- Economic indicators: Annual historical economic indicators, energy security, energy efficiency and CO2 emissions.
- Supply indicators: Annual historical reserves, capacity, production and external trade (imports(+) exports(-) balance).
- Demand indicators: Annual historical consumption per capita, consumption trends, total consumption, final consumption (per energy and per sector) and electricity consumption total and per sector.
- Energy Balance: total and per energy.
- Malaysia Energy Prices: In addition to the analysis provided on the report we also provided a data set which includes historical details on the Malaysia energy prices for the follow items: price of premium gasoline (taxes incl.), price of diesel (taxes incl.), price of electricity in industry (taxes incl.), price of electricity for households (taxes incl.), price of natural gas in industry (taxes incl.), prices of natural gas for households (taxes incl.), spot price of Brent and CO2 emissions (from fuel combustion).
The Malaysia country dashboards are complemented with country forecasts from EnerFuture (excel file) with scenario comparison.
Data included in the excelsheet:
- Demand: Primary energy consumption, final energy consumption, by fuel, by sector.
- Power: Electricity generation & capacities, by technology.
- CO2: Total CO2 emissions.
- Macro-economy: Main macro-economic assumptions.
- Key indicators: Energy intensity, share of renewables, CO2 emissions per capita and per unit of GDP.