Israel Key Figures
- Population:
- 9.97 million
- GDP growth rate:
- 0.87 %/year
- Energy independence:
- 93.9%
Data of the last year available: 2024
- Total consumption/GDP:*
- 81.9 (2015=100)
- CO2 Emissions:
- 5.99 tCO2/cap
- Rate of T&D power losses:
- 5.94%
* at purchasing power parity
View all macro and energy indicators in the Israel energy report
Israel Energy News
View all news, archive your new and create your own daily newsletters only on your topics/countries of interest with Key Energy Intelligence
Israel Energy Research
- Israel's Energy & Climate Policy Framework: Israel aims for 30% renewables in its power mix by 2030, phasing out coal by 2026. The energy sector is regulated by the Ministry of Energy and Infrastructure, with a focus on gas, solar R&D, and opening the electricity market to competition. Recent reforms include breaking the IEC monopoly and expanding the electricity transmission network. The country also targets 40% renewables by 2030, with support mechanisms like auctions and feed-in tariffs. A new climate law aims for a 30% emissions reduction by 2030 and net-zero by 2050, alongside a progressive carbon tax.
- Israel's Energy Companies: IEC dominates Israel's electricity sector, owning power plants and managing transmission and distribution. Private IPPs hold over half of the generation capacity. Oil and gas sectors involve major players like Naphta, IPC, and Energean, with significant offshore discoveries and export deals.
- Israel's Energy Supply & Demand: Israel's energy supply has grown, with gas dominating (71% of power mix) and reserves at 709 bcm. Solar capacity has doubled since 2019, reaching 5.6 GW. Electricity production increased to 77 TWh, with gas at 71% and solar at 11%. Oil and coal imports have declined, while gas exports to Egypt and Jordan surged. CO2 emissions fell 21% since 2012.
- Israel's Energy Use & Price by Sector: In 2024, final energy demand rose to 16 Mtoe, with oil, electricity, and gas as primary sources. Households and services led consumption, while transport and industry followed. Energy prices, particularly for electricity and gasoline, have increased significantly.
- Israel's Issues & Prospects: Israel is expanding its solar sector, with 1.3 GW of projects in development and plans to increase solar's share in the power mix to 30% by 2030. The government is investing ILS80bn (USUSD 23bn) to support this growth, alongside gas and hydropower projects. Additionally, Israel is advancing gas exploration and infrastructure, including the EuroAsia Interconnector and new pipelines to Egypt.
Benefit from up to 2 000 up-to-date data series for 186 countries in Global Energy & CO2 data
A data overview is available in the global energy statistics app
Israel Total Energy Production & Consumption
After peaking in 2012 and then declining until 2014, the country's primary energy consumption grew by 1.7%/year on average until 2024, reaching 25.5 Mtoe. Consumption per capita is 2.5 toe (i.e., 20% less than the Middle East average).
The energy mix is dominated by fossil fuels, with a similar share of oil and gas (44% for gas and 39% for oil). The share of oil has decreased by 5 points since 2010, while that of gas rose by 25 pp to the detriment of coal (-20 pp to 14% in 2024). Solar has a share of around 3%, while wind and biomass are marginal (0.5%).
Source: Israel energy report
Interactive Chart Israel Total Energy Production & Consumption
Source: Global Energy & CO2 data
Benefit from up to 2 000 up-to-date data series for 186 countries in Global Energy & CO2 data
View the detailed fondamentals of the market at country level (graphs, tables, analysis) in the Israel energy report
Israel Oil Production & Consumption
Oil production is limited (500 kt in 2024). Crude oil imports were relatively stable (around 14 Mt) between 2013 and 2019 before falling by 17% in 2020 then recovering to 14 Mtin 2024.
The country has 2 refineries: Haifa (196 kb/d) and Ashdod (100 kb/d). Oil Refineries commissioned a new hydrocracking unit of 25 kb/d at its Haifa refinery in 2013 to produce cooking gas, naphtha, kerosene, and high-quality diesel. Consumption of oil products has remained stable at around 8 Mt since 2014 (8.5 Mt in 2024).
Source: Israel energy report
Interactive Chart Israel Crude Oil Production & Consumption
Source: Global Energy & CO2 data
Interactive Chart Israel Refined Oil Products Production & Consumption
Source: Global Energy & CO2 data
Benefit from up to 2 000 up-to-date data series for 186 countries in Global Energy & CO2 data
Additionally, for more detailed information on refineries, you can request a sample of our EMEA Refineries Dataset
Israel Natural Gas Production & Consumption
Production has accelerated since 2019 and has tripled, reaching 27 bcm in 2024. It increased very rapidly in 2019 from around 3 bcm in 2010 to 8.8 bcm (+12%/year on average). Israel has 3 operational offshore gas fields, the main one is Leviathan with reserves of 600 bcm (condensate reserves are estimated to be 39 mbl), which started production end of 2019, followed by Tamar (200 bcm, 2013).
Source: Israel energy report
Interactive Chart Israel Gas Production & Consumption
Source: Global Energy & CO2 data
Benefit from up to 2 000 up-to-date data series for 186 countries in Global Energy & CO2 data
Additionally, for more detailed information on the LNG trade, you can request a sample of our EMEA LNG Trade Dataset
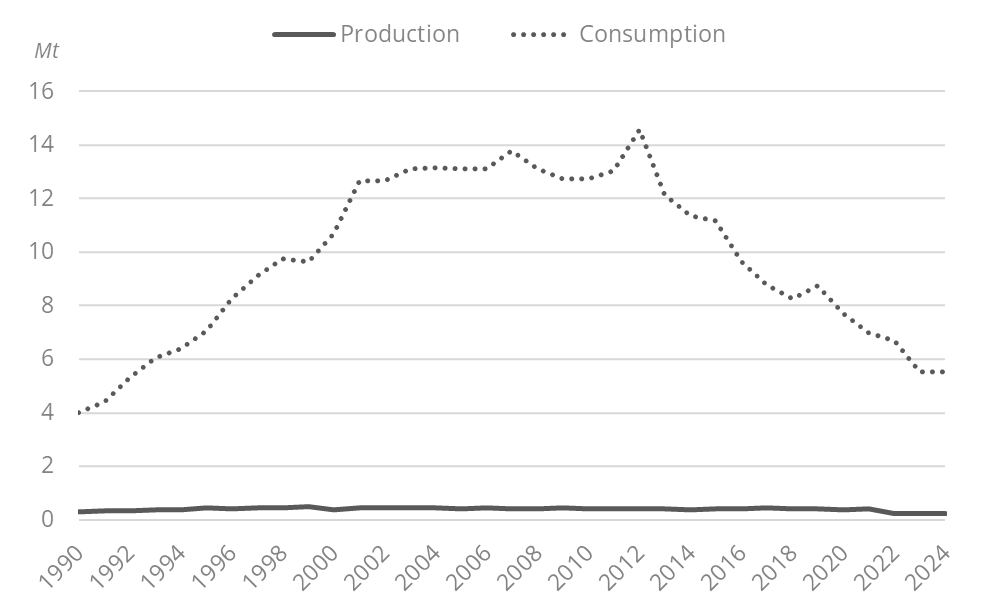
Israel Coal and Lignite Production & Consumption
Coal imports halved (-7%/year) between 2012 (14 Mt) and 2024 (5 Mt). Nearly all coal imports are used to produce electricity.
Graph: Coal Production & Consumption
Source: Israel energy report
Interactive Chart Israel Coal and Lignite Production & Consumption
Source: Global Energy & CO2 data
Benefit from up to 2 000 up-to-date data series for 186 countries in Global Energy & CO2 data
View the detailed consumption trends at country level (graphs, tables, analysis) in the Israel energy report
Israel Renewable in % Electricity Production
In 2022, the Ministry of Environment released a new renewable energy roadmap, targeting 20% of renewables in the country's power mix by 2025 and 30% by 2030. To reach the new objective, Israel would have to instal between 18 GW and 23 GW of solar capacity along with 5.5 GW / 33 GWh of storage capacity. The total potential for solar PV installations is estimated at 26 GW, including 24 GW on building roofs and facades and 2 GW over agricultural crops.
Source: Israel energy report
Interactive Chart Israel Share of Renewables in Electricity Production (incl hydro)
Source: Global Energy & CO2 data
Benefit from up to 2 000 up-to-date data series for 186 countries in Global Energy & CO2 data
Israel GHG emissions and CO2 emissions
In its updated NDC (2021), Israel increased its emissions reduction target to 27% compared to 2015 (previously 26%), including -30% in the power sector and in industry; this corresponds to total emissions of 58 MtCO2eq in 2030. The country also committed to cut emissions by at least 85% by 2050 (compared to 2015) to up to 12 MtCO2eq. According to the Ministry of Environmental Protection (2023), Israel is off track to reach its 2030 emission target, with an estimated 12% GHG cut by 2030.
Source: Israel energy report
Interactive Chart Israel CO2 emissions
Source: Global Energy & CO2 data
Benefit from up to 2 000 up-to-date data series for 186 countries in Global Energy & CO2 data
View the detailed consumption trends at country level (graphs, tables, analysis) in the Israel energy report