Indonesia Key Figures
- Population:
- 283 million
- GDP growth rate:
- 5.03 %/year
- Energy independence:
- 100%
Data of the last year available: 2024
- Total consumption/GDP:*
- 71.4 (2015=100)
- CO2 Emissions:
- 3.09 tCO2/cap
- Rate of T&D power losses:
- 8.52%
* at purchasing power parity
View all macro and energy indicators in the Indonesia energy report
Indonesia Energy News
View all news, archive your new and create your own daily newsletters only on your topics/countries of interest with Key Energy Intelligence
Indonesia Energy Research
- Indonesia's Energy & Climate Policy Framework: Indonesia has delayed its 23% renewable energy target to 2030 and plans to phase out coal by 2040. The National Energy Council oversees policy, while ESDM manages resources. The electricity sector is opening to private producers, with a focus on increasing renewables. Oil and gas production is being boosted, and coal regulations aim to secure domestic supply. Renewable energy targets and support mechanisms are in place, with biofuels and energy efficiency also being promoted. Climate change mitigation efforts include emissions trading and carbon tax plans.
- Indonesia's Energy Companies: PT PLN dominates Indonesia's electricity sector, while Pertamina leads in oil and gas. Coal production is fragmented among private firms. PT PLN plans to phase out coal plants by 2030, replacing them with renewables. Pertamina also dominates refining and gas supply, with BP and Medco as key players.
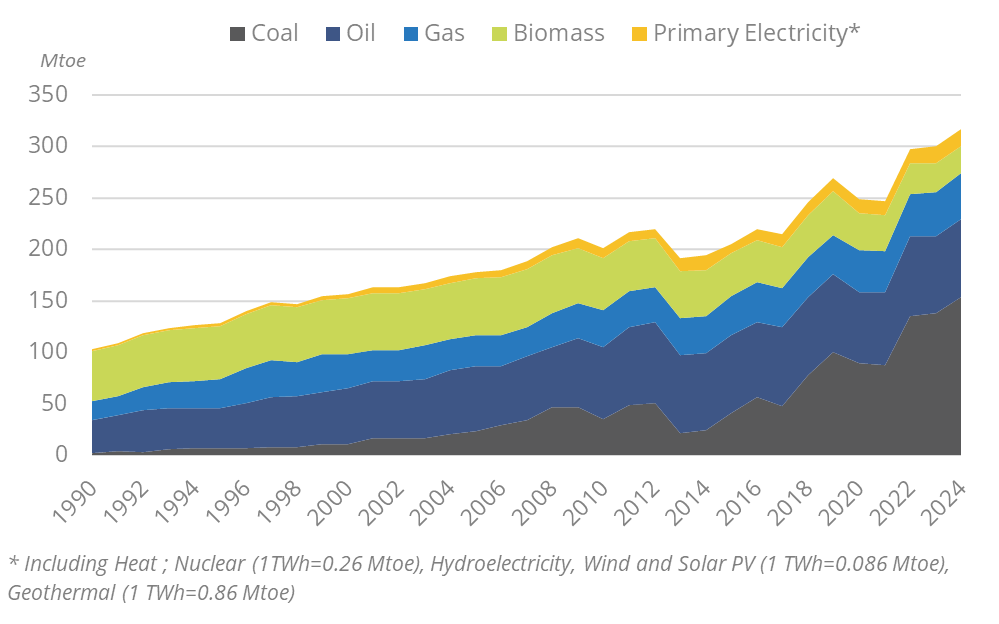
- Indonesia's Energy Supply & Demand: Indonesia's energy mix is dominated by coal (68% in 2024), with rapid growth in coal consumption and a decline in gas exports. Primary energy consumption surged post-2021, reaching 317 Mtoe in 2024. Fossil fuels account for 86.4% of the energy mix, with coal, oil, and gas leading. Electricity generation is also coal-heavy (68%), contributing to high CO2 emissions. Gas and oil sectors face production declines, while renewable energy capacity remains limited.
- Indonesia's Energy Use & Price by Sector: Energy demand in Indonesia has surged since 2021, with industry and transport leading consumption. Oil dominates the energy mix, though electricity's share is rising. Subsidies have fluctuated, with recent reductions in 2024. Prices for electricity and fuel have varied, reflecting global market trends and policy adjustments.
- Indonesia's Issues & Prospects: Indonesia aims to boost renewables to 29% by 2050, with significant investments in solar, wind, and hydropower. Despite coal phase-out plans, new coal plants are being built. Gas and oil sectors face challenges, while CCS and green hydrogen projects are advancing. Transmission infrastructure is expanding to support energy transition goals.
Benefit from up to 2 000 up-to-date data series for 186 countries in Global Energy & CO2 data
A data overview is available in the global energy statistics app
Indonesia Total Energy Production & Consumption
Primary consumption has been increasing very rapidly since 2021 (around 9%/year), reaching 317 Mtoe in 2024. It grew slower in the previous decade (3.3%/year over2010-2019).
Graph: Primary Consumption Trends by Energy Source
Source: Indonesia energy report
Interactive Chart Indonesia Total Energy Production & Consumption
Source: Global Energy & CO2 data
Benefit from up to 2 000 up-to-date data series for 186 countries in Global Energy & CO2 data
View the detailed fondamentals of the market at country level (graphs, tables, analysis) in the Indonesia energy report
Indonesia Oil Production & Consumption
Oil production has declined by 3.5%/year since 2010, reaching 32 Mt in 2024. This decline is due to the depletion of the main fields and the lack of investments.
Crude oil consumption has been decreasing since 2019 (-2.4%/year) to around 45 Mt in 2024; it remained stable around 50 Mt from 2000 to 2019.
Indonesia became a net importer of crude oil in 2012. Net crude oil imports reached 12 Mt in 2024.
Crude Oil Production & Consumption
Source: Indonesia energy report
Interactive Chart Indonesia Crude Oil Production & Consumption
Source: Global Energy & CO2 data
Interactive Chart Indonesia Refined Oil Products Production & Consumption
Source: Global Energy & CO2 data
Benefit from up to 2 000 up-to-date data series for 186 countries in Global Energy & CO2 data
Additionally, for more detailed information on refineries, you can request a sample of our Asia Refineries Dataset
Indonesia Natural Gas Production & Consumption
Natural gas production rose by 5% in 2024, reaching 72 bcm, after decreasing regularly from 2010 to 2023 (-3.4%/year). The Tiung Biru and Jambaran fields in Java began commercial operations in 2022 (1.8 bcm/year). The rapid growth in the country's natural gas production seen in the 90s (6%/year) slowed down over the 2000 decade because of depleting fields (0.6%/year between 2000 and 2008). The production fields are far from the consumption areas, located in Sumatra, Kalimantan, the Natuna Sea, Irian Jaya (western New Guinea), and Sulawesi.
Source: Indonesia energy report
Interactive Chart Indonesia Gas Production & Consumption
Source: Global Energy & CO2 data
Benefit from up to 2 000 up-to-date data series for 186 countries in Global Energy & CO2 data
Additionally, for more detailed information on the LNG trade, you can request a sample of our Asia LNG Trade Dataset
Indonesia Coal and Lignite Production & Consumption
Coal production has been growing very rapidly since 2020 (11%/year on average) reaching 833 Mt in 2024. It grew by 7%/year on average between 2015 and 2019, after very rapid growth over 2000-2013 (15%/year). Indonesia is the third largest producer of coal and lignite.
Exports increased by 6.5%/year from 2010 to 2019. After a 9% decline in 2020, they rebounded by 11%/year starting in 2021, up to 557 Mt in 2024. Indonesia is the largest coal exporter worldwide.
Graph: Coal Production & Consumption
Source: Indonesia energy report
Interactive Chart Indonesia Coal and Lignite Production & Consumption
Source: Global Energy & CO2 data
Benefit from up to 2 000 up-to-date data series for 186 countries in Global Energy & CO2 data
View the detailed consumption trends at country level (graphs, tables, analysis) in the Indonesia energy report
Indonesia Renewable in % Electricity Production
EBTKE, the Directorate General (DG) for New Energy, Renewable and Energy Conservation, focuses on renewables in power generation, whereas the DG of Electricity sets the FiT and the ceiling price for power from renewable sources.
The country targets a 23% share of renewables in the energy mix (excluding traditional biomass) in 2030 in the new KEN of 2024 (15% in 2024); this objective was postponed from 2025 as planned in the KEN 2014 (Regulation No. 79/2014).
Source: Indonesia energy report
Interactive Chart Indonesia Share of Renewables in Electricity Production (incl hydro)
Source: Global Energy & CO2 data
Benefit from up to 2 000 up-to-date data series for 186 countries in Global Energy & CO2 data
Learn more about renewables in the Mini grid Africa & Asia markets for village electrification
Indonesia GHG emissions and CO2 emissions
In its 2022 NDC, Indonesia slightly increased the country's unconditional emission reduction target from 29% in 2030 to 31.89% compared to the BAU scenario. In 2025, the country updated its second NDC for the 2031 to 2035 period, pledging to reduce its emissions by 31.89% (unconditionally) to 43.20% (conditionally) by 2030 compared to a BaU scenario.
The updated NDC aligns with Indonesia's national strategies, such as the Nation's Low Emissions Development Strategies (LTS-LCCR 2050) and the Long-Term Development Planning Document (RPJPN 2025-2045).
Source: Indonesia energy report
Interactive Chart Indonesia CO2 emissions
Source: Global Energy & CO2 data
Benefit from up to 2 000 up-to-date data series for 186 countries in Global Energy & CO2 data
View the detailed consumption trends at country level (graphs, tables, analysis) in the Indonesia energy report