
- Update
-
- Format
- 4 files (PDF report, 3 Excel files)
- Pages
-
79 (Report only)
- Delivery
- Immediate by e-mail
- GENERAL OVERVIEW
- ENERGY AND CLIMATE POLICY FRAMEWORK
- ENERGY COMPANIES
- ENERGY SUPPLY AND DEMAND
- ENERGY USE AND PRICE BY SECTOR
- ISSUES AND PROSPECTS
- STATISTICS
- ABBREVIATIONS
- GLOSSARY
Buy Indonesia energy report
Price without VAT. Depending on your status and location, VAT might be applicable. Get in touch with us for more information.
After validation, you will immediately receive 4 files by email (one pdf report and 3 excel files containing the datasets).
Overview
Indonesia has revised its energy and climate strategy, delaying its renewable energy target to 2030 while accelerating coal phase-out to 2040. Key policies include expanding domestic oil and gas production, promoting biofuels, and advancing carbon capture initiatives, alongside ambitious renewable energy and nuclear capacity goals for long-term decarbonisation.
Get more details on the table of contents and data files, as well as the list of graphs and tables by browsing the tabs below.
Highlights
- The country postponed its target for a 23% share of renewables in the energy mix from 2025 to 2030. The phase-out of coal-fired power generation was advanced from 2056 to 2040.
- PT PLN represents around half of the electricity supply.
- IOCs provide most of the oil and gas production.
- The coal sector is fragmented with mostly private players.
- Coal dominates the power mix with a stable market share since 2018 (67% in 2025).
- Gas exports have decreased by 62% since 2010.
- Final energy consumption is increasing rapidly since 2021 (12%/year).
- Since 2025, the government is restricting energy subsidies to low-income households.
- According to the National Energy Outlook, energy demand is expected to increase by 5% per year by 2050.
- Indonesia received over US$20bn to shut its coal fired plants.
Energy & Climate Policy Framework
ESDM, the Ministry of Energy and Mineral Resources (or MEMR) is in charge of developing national resources and regulating state monopolies.
Energy Companies
Electricity:
PT PLN is the main actor in power generation, with a capacity of 47 GW. It represented 49% of the total capacity in 2024 and is dominated by gas (50%), followed by coal (40%), hydro (6%), oil (3%), and other renewables (1%). PT PLN production increased by 2.8% to 184 TWh in 2024 (48% of the total).
Energy Supply & Demand
Resources:
The country's proven gas reserves are 921 bcm (2025). They have increased by 19 bcmin 2023 and stayed at the same level in 2024 and 2025, after a regular decrease of 10%/year since 2019. Proven oil reserves, more stable, are estimated at 328 Mt and has not changed in 2025 either, after a 19 Mt increase in 2023.
Energy Use and Price by Sector
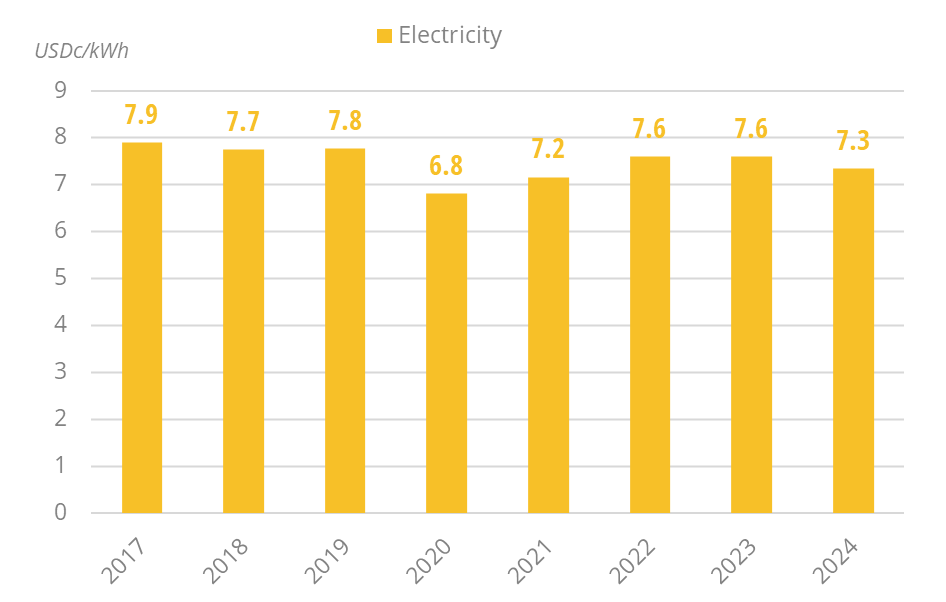
Energy Prices in Residential:
In 2025, household electricity prices decreased by 11% to 3.5 USDc/kWh.
Graph: Energy Prices in Residential (Taxes Included)
Issues & Prospects
The KEN, through the National Energy Council projects the following energy mix in the BAU scenario: renewables 29% in 2050, oil 21% and 16%, gas 24% and 23%, coal 34% and 32%. The final energy consumption would reach 549 Mtoe in 2050.
- Graph 1: Final intensity to GDP
- Graph 2: Primary Consumption Trends by Energy Source
- Graph 3: Total Consumption Market Share by Energy (2025)
- Graph 4: Installed Electric Capacity by Source
- Graph 5: Installed Electric Capacity by Source (2025)
- Graph 6: Gross Power Production by Source & Consumption
- Graph 7: Power Generation by Source (2025)
- Graph 8: CO2 Intensity of Electricity Generation
- Graph 9: Petroleum Products Production & Consumption
- Graph 10: Gas Production & Consumption
- Graph 11: Coal Production & Consumption
- Graph 12: Emissions of GHG and CO2 from Fuel Combustion
- Graph 13: CO2-Emissions per Capita
- Graph 14: CO2 Intensity to GDP
- Graph 15: Final Demand Trends by Energy Source
- Graph 16: Final Consumption by Sector
- Graph 17: Final Consumption Market Share by Sector (2025)
- Graph 18: Share of Electricity in Total Final Energy Consumption
- Graph 19: Final Consumption in Industry by Energy Source
- Graph 20: Energy Prices in Industry (Taxes Included)
- Graph 21: Final Consumption in Transport by Energy Source
- Graph 22: Energy Prices in Transport (Taxes Included)
- Graph 23: Final Consumption in Residential, Services, Agriculture by Energy Source
- Graph 24: Energy Prices in Residential (Taxes Included)
- Graph 25: Upcoming New Capacity by Energy Source
- Economic Indicators: Annual historical data including population, GDP growth, imports and exports, inflation rate, energy security and efficiency indicators, CO2 emissions.
- Supply Indicators: Historical data including oil and gas reserves, electric and refining capacity, energy production, power production and external trade. All are detailed by energy source.
- Demand Indicators: Historical data including consumption per inhabitant, consumption trends, total consumption by energy source, final consumption by energy source and sector, and electricity consumption by sector.
- Energy Balances: Single table displaying the overall energy industry balance per annum, also graphically displayed by energy sub-segment.
The Indonesia energy market data since 1990 and up to
is included in the Excel file accompanying the Indonesia country report.
It showcases the historical evolution, allowing users to easily work with the data.
Key Data included in the excelsheet:
- Economic indicators: Annual historical economic indicators, energy security, energy efficiency and CO2 emissions.
- Supply indicators: Annual historical reserves, capacity, production and external trade (imports(+) exports(-) balance).
- Demand indicators: Annual historical consumption per capita, consumption trends, total consumption, final consumption (per energy and per sector) and electricity consumption total and per sector.
- Energy Balance: total and per energy.
- Indonesia Energy Prices: In addition to the analysis provided on the report we also provided a data set which includes historical details on the Indonesia energy prices for the follow items: price of premium gasoline (taxes incl.), price of diesel (taxes incl.), price of electricity in industry (taxes incl.), price of electricity for households (taxes incl.), price of natural gas in industry (taxes incl.), prices of natural gas for households (taxes incl.), spot price of Brent and CO2 emissions (from fuel combustion).
The Indonesia country dashboards are complemented with country forecasts from EnerFuture (excel file) with scenario comparison.
Data included in the excelsheet:
- Demand: Primary energy consumption, final energy consumption, by fuel, by sector.
- Power: Electricity generation & capacities, by technology.
- CO2: Total CO2 emissions.
- Macro-economy: Main macro-economic assumptions.
- Key indicators: Energy intensity, share of renewables, CO2 emissions per capita and per unit of GDP.