Estonia Key Figures
- Population:
- 1.37 million
- GDP growth rate:
- -3.0 %/year
- Energy independence:
- 100%
Data of the last year available: 2023
- Total consumption/GDP:*
- 54.8 (2005=100)
- CO2 Emissions:
- 5.05 tCO2/capita
- Rate of T&D power losses:
- 14.7%
* at purchasing power parity
View all macro and energy indicators in the Estonia energy report
Estonia Energy News
View all news, archive your new and create your own daily newsletters only on your topics/countries of interest with Key Energy Intelligence
Estonia Energy Research
Benefit from up to 2 000 up-to-date data series for 186 countries in Global Energy & CO2 data
A data overview is available in the global energy statistics app
Estonia Total Energy Production & Consumption
Total energy consumption per capita is about 3 toe/cap (2023), i.e. 9% above the EU average. This is mainly due to the high share of oil shale, since it requires a significant amount of energy to be processed. Electricity consumption per capita is below the EU average (4 600 kWh, -15%).
Graph: CONSUMPTION TRENDS BY ENERGY SOURCE (Mtoe)
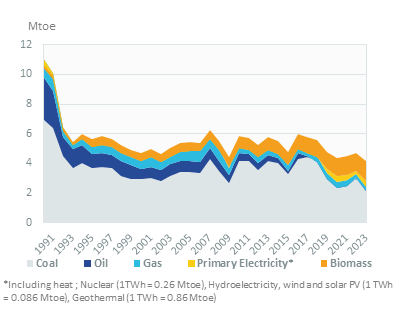
Note: coal corresponds to oil shales
Source: Estonia energy report
Interactive Chart Estonia Total Energy Production & Consumption
Source: Global Energy & CO2 data
Benefit from up to 2 000 up-to-date data series for 186 countries in Global Energy & CO2 data
View the detailed fondamentals of the market at country level (graphs, tables, analysis) in the Estonia energy report
Estonia Oil Production & Consumption
All of the country's oil product consumption is imported (1 Mt in 2023). Gasoline imports increased by 72% between 2015 (400 kt) and 2020 (700 kt) but more than halved between 2020 and 2023 (200 kt), while diesel imports only increased by 8% to 800 kt (2023). Oil products used to come mainly from Russia, which is no longer the case (28% of the imports in 2022 and imports stopped in February 2023). Besides Russia, imports in 2022 came from Lithuania (35%), Poland (20%), Latvia, and Finland (15.5%) in 2022.
Source: Estonia energy report
Interactive Chart Estonia Crude Oil Production & Consumption
Source: Global Energy & CO2 data
Interactive Chart Estonia Refined Oil Products Production & Consumption
Source: Global Energy & CO2 data
Benefit from up to 2 000 up-to-date data series for 186 countries in Global Energy & CO2 data
Additionally, for more detailed information on refineries, you can request a sample of our EMEA Refineries Dataset
Estonia Natural Gas Production & Consumption
Since 2010, gas consumption has halved, with an accelerated decrease of 19%/year between 2021 and 2023 to 300 mcm. This can be explained by high prices in recent years, the progressive conversion of heat producers to other fuels (especially biomass), and the closure of a large fertiliser plant in 2014.
District heating is the main natural gas consumer (37% of consumption in 2023). Nearly 1/3 of the gas (36% in 2023) is consumed by the residential-tertiary-agriculture sector (including 20% for services and 15% households) and 18% by industry.
Source: Estonia energy report
Interactive Chart Estonia Gas Production & Consumption
Source: Global Energy & CO2 data
Benefit from up to 2 000 up-to-date data series for 186 countries in Global Energy & CO2 data
Additionally, for more detailed information on the LNG trade, you can request a sample of our EMEA LNG Trade Dataset
Estonia Coal and Lignite Production & Consumption
In 2023, oil shale consumption decreased by 20% and reached 12 Mt, after increasing by 12%/year between 2020 and 2022 (15 Mt). It fell by 44% between 2018 and 2020, mainly because of reduced consumption in the power sector. Between 2000 and 2014, this consumption grew rapidly by 3%/year and ranged between 18 Mt and 22 Mt until 2018.
In 2023, 24% of oil shale was consumed by power plants and 73% by other sectors, including district heating plants and liquefaction plants (to produce shale oil).
Graph: OIL SHALE CONSUMPTION (Mt)
Source: Estonia energy report
Interactive Chart Estonia Coal and Lignite Production & Consumption
Source: Global Energy & CO2 data
Benefit from up to 2 000 up-to-date data series for 186 countries in Global Energy & CO2 data
View the detailed consumption trends at country level (graphs, tables, analysis) in the Estonia energy report
Estonia Power Production & Consumption
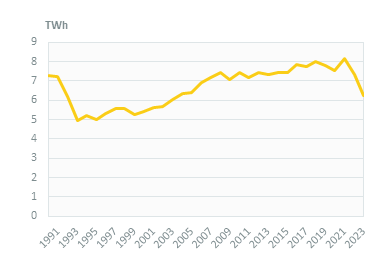
Electricity consumption fell sharply between 2021 and 2023 (12%/year) to 6.2 TWh. It rose by 1%/year between 2010 and 2021.
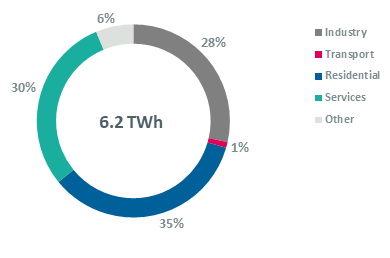
Households account for 35% of power consumption, followed by services (30%) and industry (28%) (2023).
Graph: ELECTRICITY CONSUMPTION (TWh)
Graph: ELECTRICITY CONSUMPTION BREAKDOWN BY SECTOR (2023,%)
Source: Estonia energy report
Interactive Chart Estonia Power Production & Consumption
Source: Global Energy & CO2 data
Benefit from up to 2 000 up-to-date data series for 186 countries in Global Energy & CO2 data
View the detailed consumption trends at country level (graphs, tables, analysis) in the Estonia energy report
Estonia Renewable in % Electricity Production
The NECP (2021-2030) set a target of at least 65% of renewables in total final consumption by 2030, including 100% for electricity, 63% for heating, and 14% for transport. In 2023, the share of renewables in final consumption reached 38.5%, including 31.85% for electricity, 66.7% for heating, and 9.1% for transport. The share of renewables in transport has dropped by almost 3 points since its peak at 12.2% in 2020.
The target of the EU Directive on renewables of 25% renewables in final consumption in 2020 was reached in 2011.
Source: Estonia energy report
Interactive Chart Estonia Share of Renewables in Electricity Production (incl hydro)
Source: Global Energy & CO2 data
Benefit from up to 2 000 up-to-date data series for 186 countries in Global Energy & CO2 data
Learn more about renewables in the European Battery Market Analysis
Estonia GHG emissions and CO2 emissions
Total net GHG emissions increased by 6.5% between 2020 and 2022 to 14 MtCO2-eq, after an 11% drop in 2020. Between 2010 and 2018, they fluctuated between 16 and 20 MtCO2-eq.
In its updated NECP (2023), Estonia aims to reduce GHG emissions by at least 55% by 2030 compared to the 1990 level, and by 95% by 2050. To reach this goal, the country must reduce emissions from power generation from oil shale by limiting the share of oil shale in the power mix, investing in new purification equipment, and raising the share of renewables in the power mix.
Source: Estonia energy report
Interactive Chart Estonia CO2 emissions
Source: Global Energy & CO2 data
Benefit from up to 2 000 up-to-date data series for 186 countries in Global Energy & CO2 data
View the detailed consumption trends at country level (graphs, tables, analysis) in the Estonia energy report