Estonia Key Figures
- Population:
- 1.37 million
- GDP growth rate:
- -0.3 %/year
- Energy independence:
- 100%
Data of the last year available: 2024
- Total consumption/GDP:*
- 71.3 (2015=100)
- CO2 Emissions:
- 5.92 tCO2/cap
- Rate of T&D power losses:
- 14.7%
* at purchasing power parity
View all macro and energy indicators in the Estonia energy report
Estonia Energy News
View all news, archive your new and create your own daily newsletters only on your topics/countries of interest with Key Energy Intelligence
Estonia Energy Research
- Estonia's Energy & Climate Policy Framework: Estonia aims to reduce oil shale reliance, boost renewables to 65% by 2030, and achieve 100% renewable electricity. It has fully synchronised its grid with Continental Europe, banned Russian gas imports, and targets 55% lower GHG emissions by 2030. Energy efficiency and nuclear options are also being pursued.
- Estonia's Energy Companies: Eesti Energia dominates Estonia's energy sector, controlling 85% of power generation, 95% of distribution, and 50% of sales. Utilitas leads district heating with 70% of the residential market. The sector includes state-owned and private players in electricity, oil, gas, oil shale, and district heating.
- Estonia's Energy Supply & Demand: In 2024, Estonia's energy mix saw a decline in oil shale dominance, with renewables like solar and wind reaching 35% of the power supply. Primary energy consumption fell to 4 Mtoe, while per capita consumption stood at 2.9 toe. The country's electricity capacity, at 4.1 GW, increasingly relies on renewables, with oil shale's share dropping to 39%. Estonia became a net importer of electricity, with imports accounting for 42% of consumption. Oil and gas imports are fully reliant on neighbouring countries, and GHG emissions have significantly decreased since 2018.
- Estonia's Energy Use & Price by Sector: Final energy demand has remained stable, with oil and electricity as primary sources. Prices for electricity and gas have decreased since 2022 after significant rises. Buildings account for over half of energy use, with transport and industry also major consumers.
- Estonia's Issues & Prospects: Estonia prioritises wind energy expansion, aiming for 9.4 TWh of renewable electricity by 2030, including offshore projects. Nuclear, gas, and hydropower initiatives are also underway, alongside transmission and LNG infrastructure developments.
Benefit from up to 2 000 up-to-date data series for 186 countries in Global Energy & CO2 data
A data overview is available in the global energy statistics app
Estonia Total Energy Production & Consumption
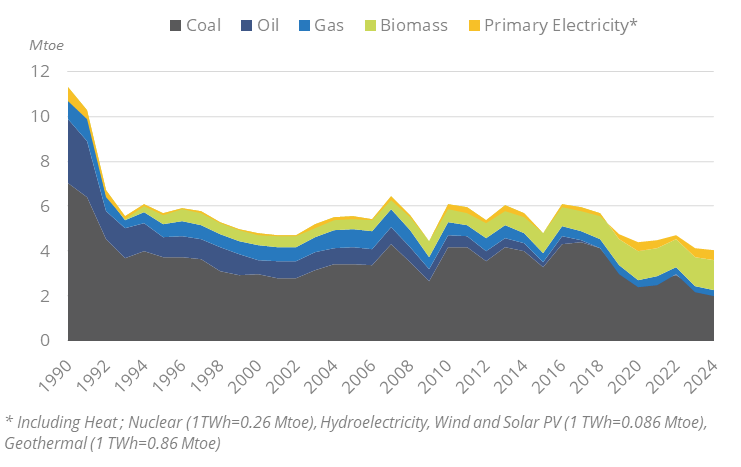
Primary energy consumption has decreased by 5%/year since 2016 to 4 Mtoe in 2024.In 2024, total energy consumption per capita is 2.9 toe. It fluctuated around 5.5 Mtoe between 2010 and 2016.
Graph: Primary Consumption Trends by Energy Source
Source: Estonia energy report
Interactive Chart Estonia Total Energy Production & Consumption
Source: Global Energy & CO2 data
Benefit from up to 2 000 up-to-date data series for 186 countries in Global Energy & CO2 data
View the detailed fondamentals of the market at country level (graphs, tables, analysis) in the Estonia energy report
Estonia Oil Production & Consumption
All of the country's oil product consumption is imported (1 Mt in 2024). Oil products used to come mainly from Lithuania (53%), followed by Finland (21%), Latvia (10%), and Sweden (4.5%) in 2024.
Since 2010, oil product consumption has remained stable at around 1.05 Mtoe. The transport sector is the largest consumer (76% in 2024), followed by residential, services, and agriculture (9%), non-energy uses (7%), and industry (4%).
Graph: Petroleum Products Production & Consumption
Source: Estonia energy report
Interactive Chart Estonia Crude Oil Production & Consumption
Source: Global Energy & CO2 data
Interactive Chart Estonia Refined Oil Products Production & Consumption
Source: Global Energy & CO2 data
Benefit from up to 2 000 up-to-date data series for 186 countries in Global Energy & CO2 data
Additionally, for more detailed information on refineries, you can request a sample of our EMEA Refineries Dataset
Estonia Natural Gas Production & Consumption
Between 2018 and 2024, gas imports decreased by 6.7%/year to 340 mcm in 2024. They averaged 1 bcm between 2005 and 2008, then fell until 2015 (471 mcm) and remained stable until 2018.
Until 2022, natural gas was mainly provided by Russia through 2 pipelines (total capacity of 8 bcm/year). Estonia is also connected to Latvia (capacity of 5.5 bcm/year) and to Finland since 2019, when Elering and its Finnish counterpart Gasum commissioned the 7.2 bcm/year Baltic Connector pipe.
Source: Estonia energy report
Interactive Chart Estonia Gas Production & Consumption
Source: Global Energy & CO2 data
Benefit from up to 2 000 up-to-date data series for 186 countries in Global Energy & CO2 data
Additionally, for more detailed information on the LNG trade, you can request a sample of our EMEA LNG Trade Dataset
Estonia Renewable in % Electricity Production
The NECP (2021-2030) set a target of at least 65% of renewables in total final consumption by 2030, including 100% for electricity, 63% for heating, and 14% for transport. In 2024, the share of renewables in final consumption reached 42.2% (+10.5 pp since 2020), including 38.9% for electricity, 67.8% for heating, and 7.7% for transport. The share of renewables in transport has dropped by 4.5 points since its peak at 12.2% in 2020.
The target of the EU Directive on renewables of 25% renewables in final consumption in 2020 was reached in 2011.
Source: Estonia energy report
Interactive Chart Estonia Share of Renewables in Electricity Production (incl hydro)
Source: Global Energy & CO2 data
Benefit from up to 2 000 up-to-date data series for 186 countries in Global Energy & CO2 data
Learn more about renewables in the European Battery Market Analysis
Estonia GHG emissions and CO2 emissions
In its updated NECP (2025), Estonia aims to reduce GHG emissions by at least 55% by 2030 compared to the 1990 level, and by 95% by 2050. To reach this goal, the country must reduce emissions from power generation from oil shale by limiting the share of oil shale in the power mix, investing in new purification equipment, and raising the share of renewables in the power mix.
Source: Estonia energy report
Interactive Chart Estonia CO2 emissions
Source: Global Energy & CO2 data
Benefit from up to 2 000 up-to-date data series for 186 countries in Global Energy & CO2 data
View the detailed consumption trends at country level (graphs, tables, analysis) in the Estonia energy report