Côte d'Ivoire Key Figures
- Population:
- 31.2 million
- GDP growth rate:
- 6.20 %/year
- Energy independence:
- 92.1%
Data of the last year available: 2023
- Total consumption/GDP:*
- 99.1 (2015=100)
- CO2 Emissions:
- 0.49 tCO2/cap
- Rate of T&D power losses:
- 13.1%
* at purchasing power parity
View all macro and energy indicators in the Côte d'Ivoire energy report
Côte d'Ivoire Energy News
View all news, archive your new and create your own daily newsletters only on your topics/countries of interest with Key Energy Intelligence
Côte d'Ivoire Energy Research
- Ivory Coast's Energy & Climate Policy Framework: Côte d’Ivoire aims for 45% renewables in its energy mix by 2030, with a 30% GHG reduction target. The government oversees energy and climate policies through dedicated ministries, aiming for energy autonomy and sustainable forestry management. Electricity regulations promote investment and rural electrification, while oil policies attract offshore exploration. Renewable energy and efficiency measures are prioritised, with mandatory audits for energy-intensive firms. The country seeks to mitigate climate change through reforestation, phasing out coal, and improving energy efficiency.
- Ivory Coast's Energy Companies: Eranove leads Côte d'Ivoire's power generation (39%), while Foxtrot and CNR dominate gas and oil production. Key players include CIE, CIPREL, and Azito in electricity, with state-owned entities managing transmission and distribution. CNR and Eni lead oil production, and Foxtrot dominates gas output.
- Ivory Coast's Energy Supply & Demand: Côte d'Ivoire's energy supply and demand have grown, with gas and oil playing key roles. The country exports electricity and oil products, while biomass dominates consumption. Installed capacity and transmission networks have expanded, and greenhouse gas emissions have risen.
- Ivory Coast's Energy Use & Price by Sector: Côte d’Ivoire's energy demand grew rapidly, dominated by biomass (56%), with households and services consuming 72%. Industry and transport saw significant shifts in energy sources and prices.
- Ivory Coast's Issues & Prospects: "Eni's Baleine project and a 112 MW hydropower plant are set for 2026. Over 5 GW of electricity capacity, including gas, solar, and hydropower, is under development or construction. Additional hydropower projects totaling 1,100 MW are planned by 2030."
Benefit from up to 2 000 up-to-date data series for 186 countries in Global Energy & CO2 data
A data overview is available in the global energy statistics app
Côte d'Ivoire Total Energy Production & Consumption
Energy consumption per capita was around 0.51 toe in 2023, which is higher than the average for Sub-Saharan Africa. Per capita electricity consumption reached 340 kWh in 2023, which is only 3% above the average for Sub-Saharan Africa.
Total energy consumption has risen by an average of 10%/year since 2019, reaching 16 Mtoe in 2023. It declined by 0.5%/year between 2015 and 2018 and grew by almost 7%/year between 2011 and 2014.
Source: Côte d'Ivoire energy report
Interactive Chart Côte d'Ivoire Total Energy Production & Consumption
Source: Global Energy & CO2 data
Benefit from up to 2 000 up-to-date data series for 186 countries in Global Energy & CO2 data
View the detailed fondamentals of the market at country level (graphs, tables, analysis) in the Côte d'Ivoire energy report
Côte d'Ivoire Oil Production & Consumption
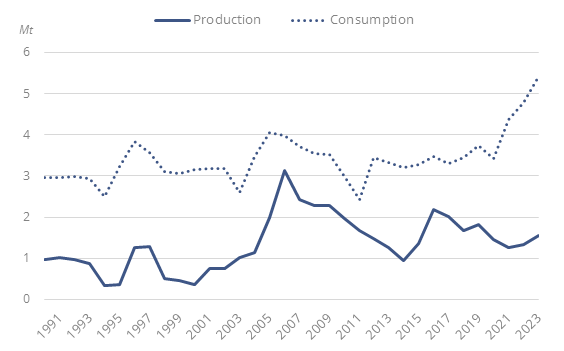
In 2023, crude oil and NGL output increased by 16% to 1.6 Mt, driven up by the start of production at block CI-101 & 802. Output at other blocks declined. Most of the country's oil is still extracted from Block CI-40, accounting for 57% of the total, followed by Block C-16 (26% of the total).
The country is a net importer of crude oil, reaching 4 Mt in 2023.
Graph: Crude Oil Production & Consumption (Mt)
Source: Côte d'Ivoire energy report
Interactive Chart Côte d'Ivoire Crude Oil Production & Consumption
Source: Global Energy & CO2 data
Interactive Chart Côte d'Ivoire Refined Oil Products Production & Consumption
Source: Global Energy & CO2 data
Benefit from up to 2 000 up-to-date data series for 186 countries in Global Energy & CO2 data
Additionally, for more detailed information on refineries, you can request a sample of our EMEA Refineries Dataset
Côte d'Ivoire Natural Gas Production & Consumption
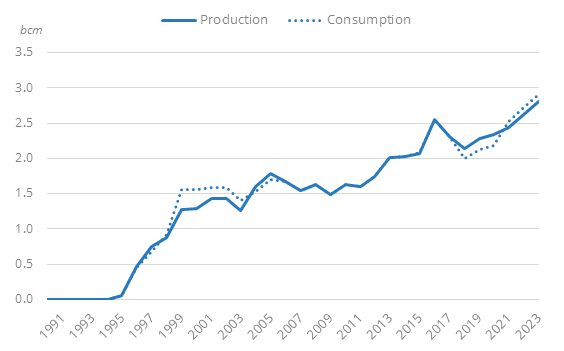
Gas production rose from 2.2 bcm in 2018 to 2.8 bcm in 2023 (+6%/year on average). Block CI-27 accounts for more than 80% of the country's natural gas output (compared to 66% in 2017).
Côte d'Ivoire does not export gas and most of the production is consumed by the power sector.
Graph: Gas Production & Consumption (bcm)
Source: Côte d'Ivoire energy report
Interactive Chart Côte d'Ivoire Gas Production & Consumption
Source: Global Energy & CO2 data
Benefit from up to 2 000 up-to-date data series for 186 countries in Global Energy & CO2 data
Additionally, for more detailed information on the LNG trade, you can request a sample of our EMEA LNG Trade Dataset
Côte d'Ivoire Renewable in % Electricity Production
According to its updated NDC (2022), the country seeks to reach a 45% share of renewables in the electricity mix (25% in 2023).
There are currently no feed-in tariffs. The power purchase agreements are signed between the government and the promoter after a call for tenders or detailed feasibility studies under an MoU.
Source: Côte d'Ivoire energy report
Interactive Chart Côte d'Ivoire Share of Renewables in Electricity Production (incl hydro)
Source: Global Energy & CO2 data
Benefit from up to 2 000 up-to-date data series for 186 countries in Global Energy & CO2 data
Côte d'Ivoire GHG emissions and CO2 emissions
In its updated NDC (2022), the GHG emission reduction target was raised from 28% to 30% in 2030 compared to a BAU scenario. The objective corresponds to a reduction of around 37 MtCO2eq in 2030 (compared to 9 MtCO2eq in the first NDC). Reduction efforts will focus on reforestation, phasing-out coal generation, and improving energy efficiency in buildings. With international support, the country could cut its GHG emissions in 2030 by 99% of the BAU scenario, almost reaching carbon neutrality. This unconditional objective would reduce GHG emissions by around 120 MtCO2eq.
Source: Côte d'Ivoire energy report
Interactive Chart Côte d'Ivoire CO2 emissions
Source: Global Energy & CO2 data
Benefit from up to 2 000 up-to-date data series for 186 countries in Global Energy & CO2 data
View the detailed consumption trends at country level (graphs, tables, analysis) in the Côte d'Ivoire energy report