Belgium Key Figures
- Population:
- 11.9 million
- GDP growth rate:
- 0.97 %/year
- Energy independence:
- 25.3%
Data of the last year available: 2025
- Total consumption/GDP:*
- 76.7 (2015=100)
- CO2 Emissions:
- 6.25 tCO2/cap
- Rate of T&D power losses:
- 3.99%
* at purchasing power parity
View all macro and energy indicators in the Belgium energy report
Belgium Energy News
View all news, archive your new and create your own daily newsletters only on your topics/countries of interest with Key Energy Intelligence
Belgium Energy Research
- Belgium's Energy & Climate Policy Framework: Belgium has removed its nuclear phase-out, updated its energy governance across federal and regional levels, and targets 20.4% renewable energy by 2030 alongside broader climate commitments.
- Belgium's Energy Companies: Engie maintains a dominant position in the Belgian energy market, leading both electricity generation and gas supply, while regional operators manage distribution and Elia oversees transmission.
- Belgium's Energy Supply & Demand: Belgium’s 2025 energy profile shows high per capita consumption, heavy reliance on fossil fuels, and a declining power generation sector, despite significant growth in renewable and CO2-free capacity.
- Belgium's Energy Use & Price by Sector: Final energy consumption has fallen 2% annually since 2021, with oil dominating at 49%. Electricity and gas prices remain notably higher than the EU average, impacting residential and industrial costs.
- Belgium's Issues & Prospects: Belgium is expanding its energy infrastructure, focusing on offshore wind, nuclear asset negotiations, LNG terminal capacity, and hydrogen strategies to meet rising long-term electricity demand.
Benefit from up to 2 000 up-to-date data series for 186 countries in Global Energy & CO2 data
A data overview is available in the global energy statistics app
Belgium Total Energy Production & Consumption
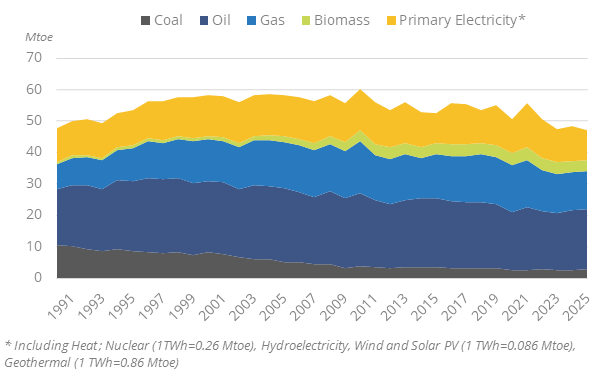
In 2025, total energy consumption at normal climate has been decreasing by 3.7% since 2021 to 47 Mtoe, after a sharp post-Covid rebound in 2021 (+10%). Previously, between 2010 and 2019, energy consumption at normal climate decreased by 1%/year.
Consumption per capita is much higher than the EU average: 3.9 toe in 2025, which is 43% higher.
Graph: Primary Consumption Trends by Energy Source
Source: Belgium energy report
Interactive Chart Belgium Total Energy Production & Consumption
Source: Global Energy & CO2 data
Benefit from up to 2 000 up-to-date data series for 186 countries in Global Energy & CO2 data
View the detailed fondamentals of the market at country level (graphs, tables, analysis) in the Belgium energy report
Belgium Oil Production & Consumption
All the oil is imported (31 Mt in 2025). Crude oil accounts for around 56% of oil imports. In 2025, 23% of crude oil was imported from Norway, from Kazakhstan (17%), from the US (15%), from OPEP countries (11%) and from the UK (4%). Crude oil consumption decreased by 5% to 30 Mtoe in 2025 after a 3.4%/year increase over 2020-2024. Previously, it fluctuated around 35 Mtoe over 2010-2019.
Source: Belgium energy report
Interactive Chart Belgium Crude Oil Production & Consumption
Source: Global Energy & CO2 data
Interactive Chart Belgium Refined Oil Products Production & Consumption
Source: Global Energy & CO2 data
Benefit from up to 2 000 up-to-date data series for 186 countries in Global Energy & CO2 data
Additionally, for more detailed information on refineries, you can request a sample of our EMEA Refineries Dataset
Belgium Natural Gas Production & Consumption
Since 2000, all the gas consumed is imported (net imports amounted to 14.4 bcm in 2025. LNG imports are increasing rapidly and represented 58% of gas imports in 2025 (up from 20% in 2021). In 2024, Russian's share in imported LNG remained significant (around 60%). In 2025, the government implemented restriction on Russian LNG imports.
The country has an LNG regasification unit in Zeebrugge with a capacity of 15.4 bcm/year.
Source: Belgium energy report
Interactive Chart Belgium Gas Production & Consumption
Source: Global Energy & CO2 data
Benefit from up to 2 000 up-to-date data series for 186 countries in Global Energy & CO2 data
Additionally, for more detailed information on the LNG trade, you can request a sample of our EMEA LNG Trade Dataset
Belgium Coal and Lignite Production & Consumption
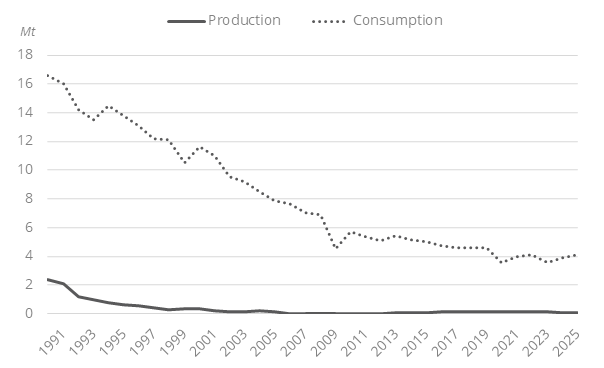
Coal production ceased in 2016. In 2025, coal imports reached around 4.0 Mt (-10% compared to 2024) after remaining stable between 2023 and 2024. In 2022, they increased by 13%. In 2025, they were 41% lower than in 2010.
Coal consumption has been decreasing since 2010 (-2.2%/year), reaching 4.1 Mt in 2025. Most of the coal is used in industry.
Graph: Coal Production & Consumption
Source: Belgium energy report
Interactive Chart Belgium Coal and Lignite Production & Consumption
Source: Global Energy & CO2 data
Benefit from up to 2 000 up-to-date data series for 186 countries in Global Energy & CO2 data
View the detailed consumption trends at country level (graphs, tables, analysis) in the Belgium energy report
Belgium Renewable in % Electricity Production
The target set in the final NECP is 20.4% of renewables in final consumption for 2030. In 2024, this share amounted to 14.3%, of which 32% was for electricity, 11.5% for heating, and 10.8% for transport.
Belgium was 1 point short of its 2020 target.
Source: Belgium energy report
Interactive Chart Belgium Share of Renewables in Electricity Production (incl hydro)
Source: Global Energy & CO2 data
Benefit from up to 2 000 up-to-date data series for 186 countries in Global Energy & CO2 data
Learn more about renewables in the European Battery Market Analysis
Belgium GHG emissions and CO2 emissions
The policies to fight Climate Change are defined at the federal level, while the implementation is split between the State and the regions: each region has its own climate plan and target. The National Climate Commission (NCC) controls the implementation of the National Climate Plan.
The NECP set a federal binding target for GHG emissions reduction in non-ETS sectors of 47% in 2030 compared to 2005, a target that is unlikely of being met according to the NECP. Federal regions have different contributions to the -47% target: -40% in Flanders, -47% in Wallonia and -47% in Brussels.
Source: Belgium energy report
Interactive Chart Belgium CO2 emissions
Source: Global Energy & CO2 data
Benefit from up to 2 000 up-to-date data series for 186 countries in Global Energy & CO2 data
View the detailed consumption trends at country level (graphs, tables, analysis) in the Belgium energy report