Bahrain Key Figures
- Population:
- 1.58 million
- GDP growth rate:
- 2.98 %/year
- Energy independence:
- 100%
Data of the last year available: 2023
- Total consumption/GDP:*
- 98.8 (2015=100)
- CO2 Emissions:
- 23.1 tCO2/cap
- Rate of T&D power losses:
- 2.99%
* at purchasing power parity
View all macro and energy indicators in the Bahrain energy report
Bahrain Energy News
View all news, archive your new and create your own daily newsletters only on your topics/countries of interest with Key Energy Intelligence
Bahrain Energy Research
- Bahrain's Energy & Climate Policy Framework: Bahrain aims to diversify its economy, targeting 6% energy savings by 2025 and 20% renewables in power by 2035, while promoting energy efficiency and climate action.
- Bahrain's Energy Companies: "IPPs operate 80% of Bahrain's public power capacity, with Engie as the largest. Saudi Aramco leads oil production. EWA manages electricity transmission and distribution. Bapco oversees refining, while Banagas handles gas exploration."
- Bahrain's Energy Supply & Demand: Bahrain's energy supply is dominated by gas (88%), with high per capita consumption. Power generation is entirely gas-fired, and the country has significant oil and gas reserves. Recent investments include the Al Dur 2 IWPP and a planned LNG import terminal. CO2 emissions have stabilised post-2020.
- Bahrain's Energy Use & Price by Sector: Industry dominates Bahrain's energy use, with electricity prices stable post-2019. Final energy demand grew 3.5% annually since 2012, led by electricity (40%), gas (35%), and oil (25%). Industry and non-energy uses account for 59% of consumption. Transport relies solely on oil, while residential and services use mostly electricity. Energy prices rose significantly post-2016 due to subsidy cuts.
- Bahrain's Issues & Prospects: Bahrain aims for 400 MW of solar power by 2035, with projects including a 100 MW PV plant and rooftop solar initiatives. It also plans 2 GW of offshore wind and refinery expansions.
Benefit from up to 2 000 up-to-date data series for 186 countries in Global Energy & CO2 data
A data overview is available in the global energy statistics app
Bahrain Total Energy Production & Consumption
Per capita consumption is very high, fluctuating around 10 toe since 2020 (in the world's top 5 highest) due to the highly developed aluminium and petrochemical industries.
Graph: Primary Consumption Trends by Energy Source (Mtoe)
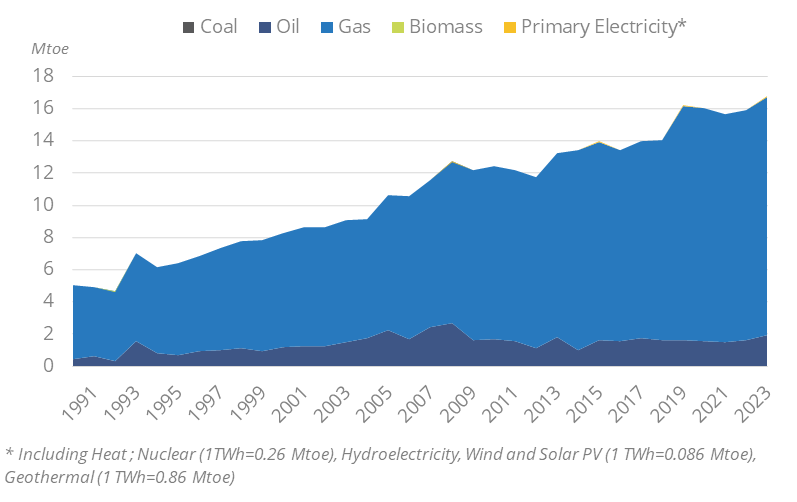
Total energy supply (i.e. total energy consumption) has been fluctuating around 16 Mtoe since 2019, after growth of 3%/year over 2010-2019.
Source: Bahrain energy report
Interactive Chart Bahrain Total Energy Production & Consumption
Source: Global Energy & CO2 data
Benefit from up to 2 000 up-to-date data series for 186 countries in Global Energy & CO2 data
View the detailed fondamentals of the market at country level (graphs, tables, analysis) in the Bahrain energy report
Bahrain Oil Production & Consumption
Oil production has remained stable since 1990 (9.7 Mt in 2023). Around 80% of the production comes from the Abu Sa'fah field.
The country has a refining capacity of 267 kb/d (Sitra refinery on Sitra island, south of Manama). Most of the crude oil used is imported (85% from Saudi Arabia).
Source: Bahrain energy report
Interactive Chart Bahrain Crude Oil Production & Consumption
Source: Global Energy & CO2 data
Interactive Chart Bahrain Refined Oil Products Production & Consumption
Source: Global Energy & CO2 data
Benefit from up to 2 000 up-to-date data series for 186 countries in Global Energy & CO2 data
Additionally, for more detailed information on refineries, you can request a sample of our EMEA Refineries Dataset
Bahrain Natural Gas Production & Consumption
Gas production remained stable from 2019 to 2023 (around 18 bcm in 2023). It had previously increased by 17% in 2019 thanks to the improvement of existing fields and the commissioning by Banagas of a new gas production plant in 2018, which doubled the gas processing capacity. Previously, gas production remained stable between 2014 and 2018 at nearly 15 bcm.
Gas consumption has also remained stable since 2019 (17 bcm in 2023). Around 62% of the gas is used for power generation and around 11% in the petrochemical industry.
Source: Bahrain energy report
Interactive Chart Bahrain Gas Production & Consumption
Source: Global Energy & CO2 data
Benefit from up to 2 000 up-to-date data series for 186 countries in Global Energy & CO2 data
Additionally, for more detailed information on the LNG trade, you can request a sample of our EMEA LNG Trade Dataset
Bahrain Renewable in % Electricity Production
The National Renewable Energy Action Plan (NREAP, 2017) set a target of 5% of renewables in the public power capacity by 2025 and 20% by 2035 (revised from 10% to 20% in 2023). This corresponds to a renewable capacity of 255 MW in 2025 (200 MW of solar, 50 MW of wind, and 5 MW of biogas) and 710 MW in 2035 (400 MW of solar, 300 MW of wind, and 10 MW of biogas). The country is still far from these objectives (only 18 MW of renewables installed end of 2024).
Source: Bahrain energy report
Interactive Chart Bahrain Share of Renewables in Electricity Production (incl hydro)
Source: Global Energy & CO2 data
Benefit from up to 2 000 up-to-date data series for 186 countries in Global Energy & CO2 data
Bahrain GHG emissions and CO2 emissions
The updated NDC (2021) included numerous sectoral measures without setting an economy-wide target. Achieving the NEEAP's 6% energy savings target should cut GHG emissions by 3.4 MtCO2eq. The country aims to reach net-zero emissions by 2060.
Source: Bahrain energy report
Interactive Chart Bahrain CO2 emissions
Source: Global Energy & CO2 data
Benefit from up to 2 000 up-to-date data series for 186 countries in Global Energy & CO2 data
View the detailed consumption trends at country level (graphs, tables, analysis) in the Bahrain energy report