
- Update
-
- Format
- 3 files (PDF report, 2 Excel files)
- Pages
-
52 (Report only)
- Delivery
- Immediate by e-mail
- GENERAL OVERVIEW
- ENERGY AND CLIMATE POLICY FRAMEWORK
- ENERGY COMPANIES
- ENERGY SUPPLY AND DEMAND
- ENERGY USE AND PRICE BY SECTOR
- ISSUES AND PROSPECTS
- STATISTICS
- ABBREVIATIONS
- GLOSSARY
Buy Bahrain energy report
Price without VAT. Depending on your status and location, VAT might be applicable. Get in touch with us for more information.
After validation, you will immediately receive 3 files by email (one pdf report and 2 excel files containing the datasets).
Overview
Bahrain is advancing its energy transition with ambitious targets for renewables and efficiency, aiming to diversify beyond hydrocarbons. Governed by multiple ministries and the newly established Sustainable Energy Authority, the nation seeks to expand solar capacity, enhance efficiency measures, and reduce reliance on gas-fired power. Despite progress, challenges remain in meeting renewable goals and balancing economic growth with sustainability.
Get more details on the table of contents and data files, as well as the list of graphs and tables by browsing the tabs below.
Highlights
- The country targets 6% of energy savings (compared to BAU) in 2025 and 20% of renewables in the power capacity mix in 2035.
- Autoproducers own around half of the power capacity. IPPs operate around 80% of the public power capacity. Engie is the largest IPP.
- Saudi Aramco is the main oil producer.
- Power generation is nearly 100% based on gas.
- Per capita consumption is among the top 5 highest in the world.
- Industry represents more than half of the electricity consumption.
- Electricity prices are stable, after rapid growth for industry users from 2016 to 2019.
- Bahrain targets 200 MW of solar PV by 2025 and 400 MW by 2035.
Energy & Climate Policy Framework
The Ministry of Electricity and Water Affairs supervises the electricity sector, renewables, and energy efficiency.
The Ministry of Oil and Environment regulates the oil and gas sector.
The Supreme Council for Environment oversees sustainable development and climate change related issues.
Energy Companies
Electricity:
Three IPPs operate around 80% of the public power capacity (i.e. main activity producers, excluding autoproducers); they all sell electricity to EWA under 20-year Power and Purchase Agreements (PPAs).
Energy Supply & Demand
Resources:
The country's proven oil reserves are estimated at 23 Mt (end 2023) and the gas reserves at 68 bcm (end of 2023). The gas reserves dropped significantly in 2020 as the Energy Ministry announced that the Khalij al-Bahrein unconventional basin was deemed uneconomic.
Energy Use and Price by Sector
Energy Prices in Residential:
Tariffs for domestic and small consumers (below 5 000 kWh/year) have not been modified: BHD0.3c/kWh (US$0.8c/kWh) for consumption below 3 000 kWh/year, BHD0.9c/kWh (US$2.4c/kWh) between 3 001 kWh and 5 000 kWh/year, and BHD1.6c/kWh (US$4.3c/kWh) above 5 000 kWh/year.
Graph: Energy Prices Including Taxes in Residential (USDc/kWh GCV)
Issues & Prospects
Electricity:
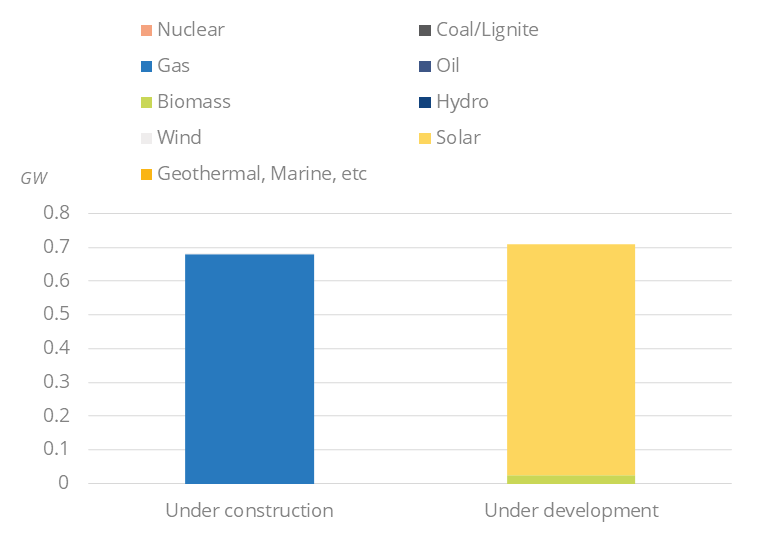
Bahrain's electricity and water master plan projects that peak demand in summer will almost double from 3.4 GW in 2016 to 6.5 GW in 2030.
Graph: Upcoming New Capacity by Energy Source (GW)
- Graph 1: Primary Consumption Trends by Energy Source (Mtoe)
- Graph 2: Total Consumption Market Share by Energy (2023, %)
- Graph 3: Installed Electric Capacity by Source (GW)
- Graph 4: Installed Electric Capacity by Source (2023, %)
- Graph 5: Gross Power Production by Source & Consumption (TWh)
- Graph 6: Power Generation by Source (2023, %)
- Graph 7: Crude Oil Production & Consumption (Mt)
- Graph 8: Petroleum Products Production & Consumption (Mt)
- Graph 9: Gas Production & Consumption (bcm)
- Graph 10: GHG Emissions and CO2-energy Emissions (MtCO2)
- Graph 11: Final Demand Trends by Energy Source (Mtoe)
- Graph 12: Final Consumption by Sector (Mtoe)
- Graph 13: Final Consumption Market Share by Sector (2023, %)
- Graph 14: Final Consumption in Industry by Energy Source (Mtoe)
- Graph 15: Energy Prices Including Taxes in Industry (USDc/kWh GCV)
- Graph 16: Final Consumption in Transport by Energy Source (Mtoe)
- Graph 17: Energy Prices Including Taxes in Transport (USD/l)
- Graph 18: Final Consumption in Residential, Services, Agriculture by Energy Source (Mtoe)
- Graph 19: Energy Prices Including Taxes in Residential (USDc/kWh GCV)
- Graph 20: Upcoming New Capacity by Energy Source (GW)
- Economic Indicators: Annual historical data including population, GDP growth, imports and exports, inflation rate, energy security and efficiency indicators, CO2 emissions.
- Supply Indicators: Historical data including oil and gas reserves, electric and refining capacity, energy production, power production and external trade. All are detailed by energy source.
- Demand Indicators: Historical data including consumption per inhabitant, consumption trends, total consumption by energy source, final consumption by energy source and sector, and electricity consumption by sector.
- Energy Balances: Single table displaying the overall energy industry balance per annum, also graphically displayed by energy sub-segment.
The Bahrain energy market data since 1990 and up to
is included in the Excel file accompanying the Bahrain country report.
It showcases the historical evolution, allowing users to easily work with the data.
Key Data included in the excelsheet:
- Economic indicators: Annual historical economic indicators, energy security, energy efficiency and CO2 emissions.
- Supply indicators: Annual historical reserves, capacity, production and external trade (imports(+) exports(-) balance).
- Demand indicators: Annual historical consumption per capita, consumption trends, total consumption, final consumption (per energy and per sector) and electricity consumption total and per sector.
- Energy Balance: total and per energy.
- Bahrain Energy Prices: In addition to the analysis provided on the report we also provided a data set which includes historical details on the Bahrain energy prices for the follow items: price of premium gasoline (taxes incl.), price of diesel (taxes incl.), price of electricity in industry (taxes incl.), price of electricity for households (taxes incl.), price of natural gas in industry (taxes incl.), prices of natural gas for households (taxes incl.), spot price of Brent and CO2 emissions (from fuel combustion).