Energy consumption for transport decoupling from GDP growth
Transport is usually the fastest growing sector for energy demand in emerging and newly industrialized countries, which are the focus of this analysis1. Thus, as transport’s share in final energy consumption2 increases, the sector becomes ever more crucial for understanding the changing energy demand landscape in emerging countries.
The goal of this month’s brief by Bruno Lapillonne, Enerdata co-founder and internationally recognised expert on energy demand and efficiency, is to shed light on this topic.
Energy consumption from transport is growing rapidly in emerging countries. It increased on average 7 to 8% per year in China and India between 2000 to 2017. In Turkey, Malaysia, Egypt, Saudi Arabia and the UAE, annual growth was between 4 and 5%. Furthermore, because the sector consumes primarily fossil fuels, transport has an outsized impact on GHG emissions relative to its portion of a country’s total energy demand. In four of the countries analysed, transport is by far the highest consuming sector, accounting for up to 45% of final energy consumption3, and making its emissions impact even more important.
Economic Indicators: Transport Intensity of GDP
Transport intensity, which relates the energy consumption from transport to GDP, indicates how the transport sector’s consumption level changes as the economy changes.
Since 2000, transport intensity has decreased for roughly half of the 16 countries analysed in this brief. In Russia, Korea and China, the decrease has been by more than 1% per year. Since 2010, the UAE and Mexico have been on a similar path, as shown in Figure 1.
Figure 1: Decrease in Transport Intensity Shows Economic Decoupling
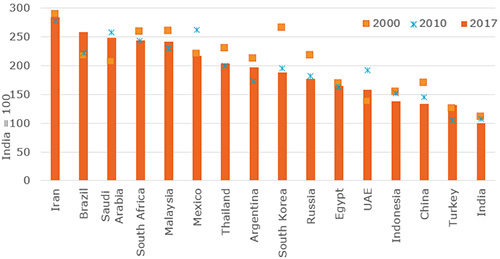
Source: Enerdata - EnerDemand; GDP in purchasing power parities
This means most of these countries have experienced an important decoupling of transport energy demand from economic growth. The trend is due to a combination of factors:
- Improvements in vehicle efficiency – especially that of passenger cars – linked to policy measures implemented
- Fuel price increases in some countries
- Growth in passengers’ mobility4 and in freight traffic being lower than GDP growth, which are often linked to infrastructure constraints, as is the case in India and China
There are important discrepancies among countries’ transport intensity levels: a factor of 3 between India and Iran for instance, and a factor of nearly 2.5 between China and Iran. In other words, Iran requires 3 times more energy to produce each dollar of GDP for its transport sector than India requires, and 2.5 times more than China.
In China and India, energy intensity is low. This is due to low rates of car ownership and the relative importance of rail transport, compared with all other countries5.
Iran’s particularly high energy intensity of transport is partly explained by low fuel prices. At the other extreme, Turkey has fuel prices that are among the highest in the world, and has very low energy intensity compared with others in this group.
As road transportation is predominant in all these countries, this analysis will now focus on passenger cars, busses, and trucks6.
Measuring the Improving Efficiency of Road Transport
Trends in road transport consumption depend on the number of vehicles and the specific consumption per vehicle (in toe, or tons of oil equivalent, per vehicle).
The first factor can be captured by the average number of vehicles per capita, the vehicle density and the population. The second one is measured by the average consumption of road transport per vehicle (in toe/vehicle, calculated by dividing the energy consumption for road transport by the number of vehicles).
As shown in Figure 2, South Korea has the highest vehicle density. China experienced the strongest increase in this indicator (14% per year since 2000), followed by Indonesia and India (approximately 7% per year). For most of the other countries, the progression is around 3 to 4% per year.
Figure 2: Vehicle Density Increasing in All Countries Studied
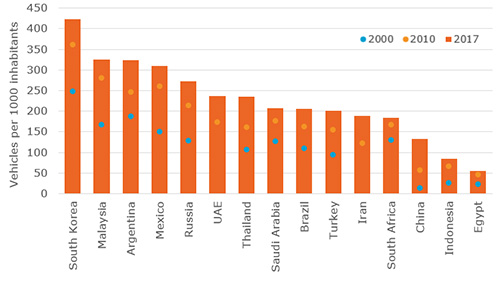
Source: Enerdata - EnerDemand
However, the specific consumption per vehicle indicator is biased by the fact that heavy vehicles (i.e., trucks and busses) are counted as cars, despite having very different energy consumption profiles. A more meaningful indicator to assess energy efficiency of road transport is the average consumption per equivalent car, in which the different types of vehicles are accounted for in equivalent car terms7.
Fuel Prices and Consumption Per Car Equivalent
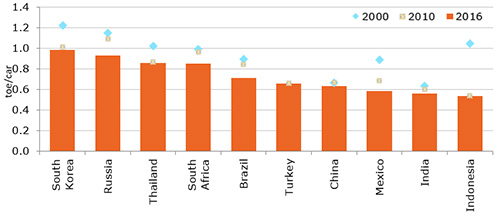
As shown in Figure 3, the unit consumption of road transport per car equivalent is decreasing in almost all countries. This trend can be mainly explained by the fact that vehicles are becoming more efficient and/or being used less (in terms of distance travelled per year) as a result of policies implemented (including standards in some countries, and price adjustments – especially in the Middle East).
In India and Indonesia, the consumption per car equivalent has significantly decreased (on average by 5.5% per year). In Turkey, the decrease is mainly thanks to fuel prices being among the highest in the world.
Figure 3: Road Transport Consumption per road vehicle
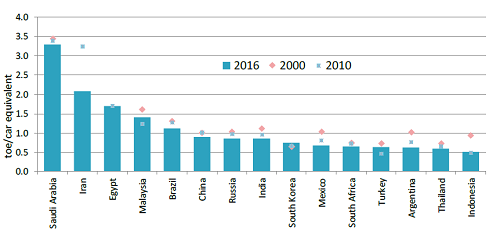
Source: Enerdata - EnerDemand
Figure 4: Energy Consumption of Road Transport Per Car Equivalent Inversely Proportionate to Gasoline Prices9 (2016)
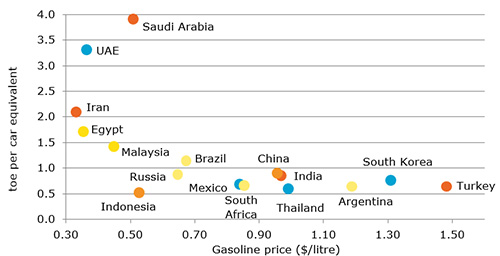
Source: Enerdata - EnerDemand and Global Energy & CO2 Data
In half of the countries analysed, cars account for the largest share of consumption of road transport; in the others it is trucks and light-duty vehicles. Motorcycles account for 18% in India, and roughly 10% or more in Brazil, Argentina, Indonesia and Thailand.
Figure 5: Significant Variance in Distribution of Road Transport by Vehicle Type Among Countries (2016)
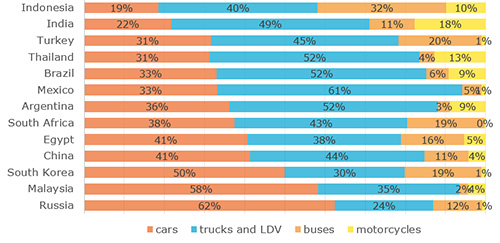
Source: Enerdata - EnerDemand
New Vehicles Help Decrease Annual Consumption Per Car
The average annual energy consumption per car is decreasing in all countries for which data could be estimated. This trend is due to several factors: less distance travelled, more efficient vehicles, and perhaps smaller cars (as is the case in Europe).
Figure 6: Vehicles’ Specific Consumption Gradually Improving, with Most Significant Decreases in Indonesia and Mexico
Source: Enerdata - EnerDemand
Fuel Efficiency Gains
The better energy performance of the vehicle stock (assessed by consumption in litres/100km) is the result of the diffusion of new, more efficient cars. The specific consumption of new cars has been decreasing rapidly since 2010 (at a rate of more than 2% per year).
Generally, this is due to mandatory standards (in Korea, Mexico and China, for example) and to the delayed impact of standards in OECD countries ¬– because a significant share of vehicles registered each year are second-hand cars imported from OECD countries.
As shown in Figure 7, South Korea, China and India have ambitious performance targets in the range of 4 to 5 litres per 100 km.
Figure 7: Specific Consumption of New Cars – Three Countries Target Fuel Efficiency Better Than 5 litres/100km
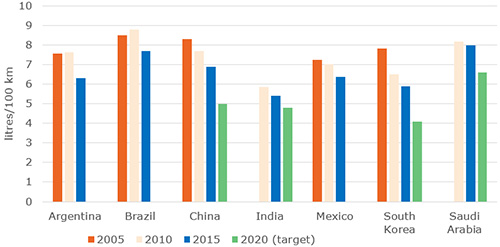
Source: Enerdata - EnerDemand based on ICCT and national sources
Final Note
The decoupling of transport energy consumption from economic growth in emerging countries is clear, and the trend is mainly policy-driven: Some of these countries have implemented energy efficiency measures – mainly emissions standards for new vehicles – both to limit energy demand growth, and to contribute to the reduction of GHG emissions. Other countries, mainly oil-producing Gulf countries, have realised the need to control the growth of their domestic oil demand, and have implemented price adjustment policies that are beginning to have some effects.
These positive efficiency trends are likely to continue, as more and more countries apply energy or CO2 emissions standards and labels. The main uncertainty lies in these countries’ capacities to develop alternative transport modes to cars and trucks.
Footnotes:
1This analysis covers a sample of 16 countries, all of which are covered by a new Enerdata service called EnerDemand. The countries analysed are Argentina, Brazil, China, Egypt, India, Indonesia, Iran, Malaysia, Mexico, Russia, Saudi Arabia, South Korea, Thailand, Turkey and the United Arab Emirates (UAE).
2 Final consumption excludes non-energy uses, as these uses are not concerned by energy efficiency.
3 Around 45% in Malaysia and Mexico, and about 40% in Saudi Arabia and Brazil (as well as a significant 36% in Egypt in 2017). These figures exclude non-energy uses, as explained above.
4 Passenger mobility is the average distance travelled per person per year.
5 Train transport is not dominant in these two countries, but is more significant than in the others.
6 Rail transport is quite important in Russia, accounting for 10% of total passenger kilometres traveled, as well as in China and India, where the figure is 5%.
7 This indicator is calculated as the ratio between the consumption of road transport and a fictitious stock of road vehicles measured in a number of equivalent cars: the actual stock of each type of vehicle is converted in equivalent cars with a coefficient reflecting the difference in annual consumption between each type of vehicle and a car. For instance, if a bus consumes 15 toe/year on average and a car 1 toe/year, one bus is equivalent to 15 cars. Single trucks and light duty vehicles are each equivalent to four cars.
8 Data for these countries are based on official data, but likely overestimate the real consumption of transport.
9 Consumption of road transport per vehicle, with the number of vehicles measured in car equivalent. 2016 data.