The new LNG markets and their geopolitical implications
Get this executive brief in pdf format
In 2000, LNG accounted for 26% of natural gas trade. Today, this share has risen to 45%, reflecting the gradual emergence of a global natural gas market. Since the end of 2010, there has been major developments in the liquefied natural gas (LNG) market. It is likely to keep evolving significantly in the 2020s and beyond, though the Covid19 pandemic will likely have a negative short-term impact on natural gas demand compared to what was previously expected. New importers and exporters have emerged, contributing to the growth of trade. However, the LNG markets are strongly linked to geopolitical factors, a key driver of their development.
Introduction
Given transport constraints, natural gas markets have traditionally been organised as three segmented regional markets: The North American market, the Asia-Pacific market, and the European market. Each market was characterised by specific suppliers and differentiated prices. LNG made it possible to lift the transport constraint, even though its cost long hindered its development. The United States (USA), relying on shale gas production, is expected to emerge in the coming years as one of the world's leading LNG exporters, thus upsetting regional market balance patterns.
LNG is increasingly asserting itself as a "commodity". For instance, changes in contractual forms of exchange (decoupling of the link between oil and gas prices, elimination of destination clauses), notably under the impetus of the United States, are helping to speed up the liberalisation of LNG trade. Alongside trade in the form of long-term Take or Pay type contracts, there has been a growth in trade on the spot markets and the development of financial markets (development of futures contracts). However, the continuation of this movement is conditioned by the emergence of spot markets and physical hubs in certain regions of the world, particularly in Asia. Indeed, if the reform processes of the gas industries, a condition for their emergence, seem to be imposed at the global level, the pace and modalities of reform are different according to the regions considered.
LNG markets are currently undergoing major changes. Since the early 2000s, LNG trade has grown strongly, by more than 80% between 2006 and 2018, to reach 368 Gm3 of imports in 2018. In recent years, there has been an increase in the number of buyers (42 countries) and sellers (20 countries). This is profoundly changing the problems of trade in terms of volume, geographical areas, and models.
These new configurations could have important geopolitical implications. The gas crises between Ukraine and Russia, the political crisis between the European Union (EU) and Russia following the annexation of the Crimea and the ensuing Western sanctions have brought the issue of the EU's energy security back to the forefront of EU energy policy. The trade war between the US and China and the solutions that will be implemented to resolve it may have a significant impact on US LNG exports. Thus, looking solely at the economic factors of competitiveness between LNG suppliers is unlikely to be sufficient to explain future trade dynamics.
Figure 1: LNG global market
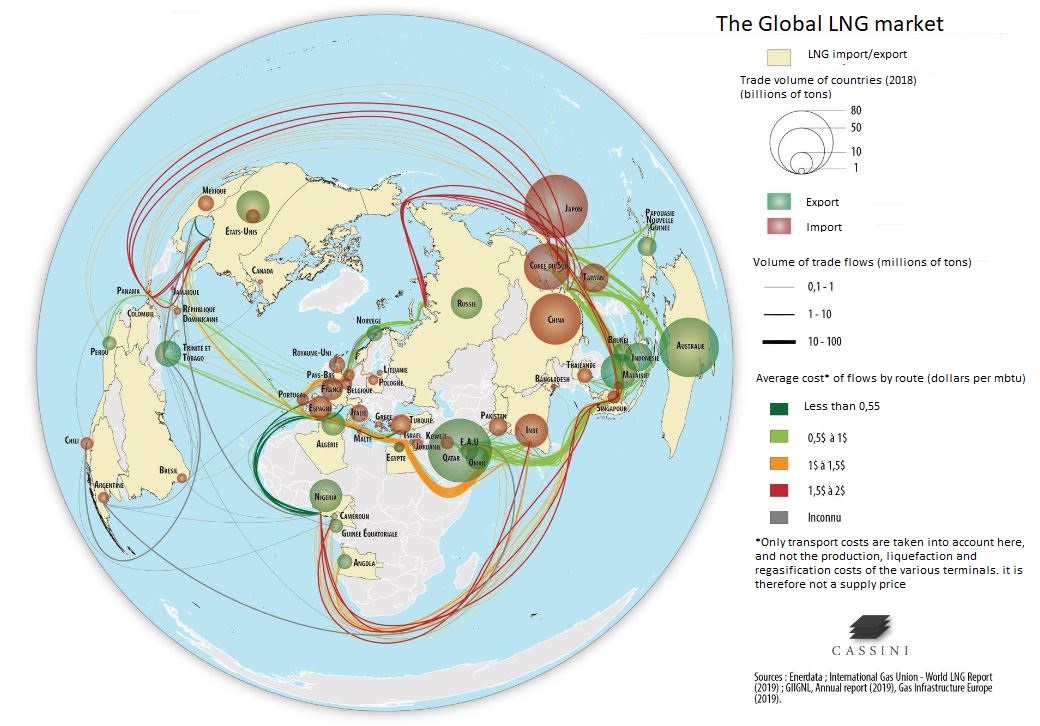
Sources: Enerdata, International Gas Union, World LNG Report (2019), GIIGNL Annual Report (2019), Gas Infrastructure Europe (2019)
The development of mid and long-term LNG exchanges
In 2018, global liquefaction capacity will reach 410 million tonnes/year, with a utilisation rate of 78.8%. Regasification capacity is 875 million tonnes/year, including a floating regasification capacity of 87 million tonnes/year. 563 LNG carriers provide the bulk of the flows.
LNG exchanges continue to have a strong regional component. Asia thus accounts for more than 70% of LNG imports. Three countries, Japan, China and South Korea, account for more than 50% of global LNG demand. While Japan is the largest LNG import market, China plays a major role in the development of trade. Its imports increased by 38% in 2018/2017 and 42% in 2017/2016. The main LNG exporting countries today are Australia, Qatar, the United States, Malaysia, and Algeria. In the medium term, this trade is expected to change somewhat and become more complex, particularly with the emergence of large new LNG exporters.
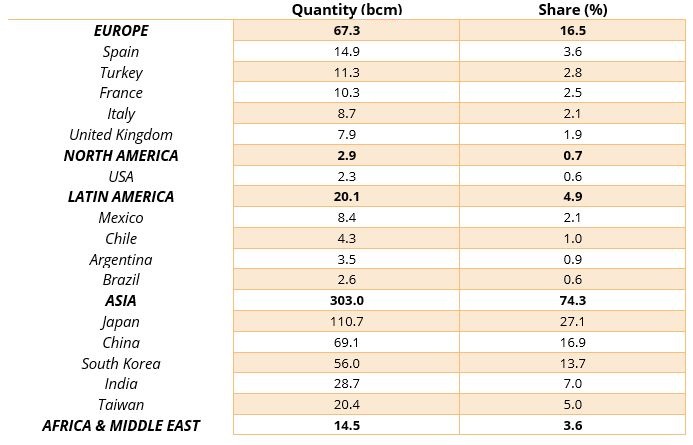
Figure 2: LNG imports in Asia, 2000-2019
Source: Enerdata, Global Energy & CO2 Data
It is estimated that LNG will be the main source of growth in natural gas trade. Global LNG trade is thus expected to more than double by 2040 to 729 bcm (more than trade by pipeline). The share of LNG in world gas trade would then be close to 60%.
However, two factors will be determining the development of LNG trade:
- The capacity of this industry to limit or even reduce the costs along the chain, particularly because of the low prices on the European and Asian spot markets,
- The competitiveness of natural gas compared with coal and especially renewable energies.
By 2030-2035, three countries will dominate LNG production and exports. They are Qatar, Australia, and the United States. And Russia ambitions to establish itself as the fourth largest LNG producer. Also noteworthy is the emergence of Mozambique and Argentina (through the development of its shale gas) as potential LNG exporters.
The Covid19 outbreak hit the global economy and energy consumption at unprecedented levels. Enerdata’s latest estimates forecast that energy consumption will drop by 12% in the USA, by 8% in Europe, and will grow by a mere 0.5% in China. Natural gas demand will not escape this trend and 2020 will present a significant drop in natural gas demand.
Although it is difficult to forecast what long term consequences Covid19 will have on natural gas markets, it is very likely that in the short to mid-term (2025-2030) the economic crisis will negatively impact natural gas demand compared to what was previously expected. This could result in supply overcapacity in LNG markets with existing and soon to be commissioned LNG facilities dimensioned for higher demand levels.
Rising use of LNG in transport (road and sea)
LNG as a marine fuel
LNG tankers have long been operating thanks to the gas naturally vaporised by the liquid/vapour balance in the tanks (boil-off effect). But it is only very recently that LNG carburation has been extended to other types of ships (cruise ships, container ships, ferries, bulk carriers, etc.) where heavy fuel oil has historically been preferred for economic reasons. The growth of this market is rapid: non-existent a few years ago, more than 170 LNG ships are in operation today in the world (including dual fuel), two thirds of which are located in the North Sea and Baltic Sea region, particularly in Norway. Nearly 100 new ships (all types) are on order for delivery by 2025. In the case of cruise ships, a sector that is highly sensitive to environmental issues, nearly one order in five is for an LNG-powered ship.
The main factor explaining this appetite for LNG as a maritime fuel is the gradual tightening of toxic gas emission standards over the last 15 years or so: shipping accounts for about 90% of global sulphur oxides (Sox) emissions from the transport sector and is also a major source of local nitrogen oxides (NOx) and particulate matter emissions around major shipping lanes and port cities. As a fuel, LNG emits virtually no sulphur, no PM particles, and reduces nitrogen oxide emissions by 85% compared with heavy fuel oil. LNG carburation is also much quieter. Another factor is the attractive price of natural gas since the explosion of American production some ten years ago.
Ship owners are willing to invest in new LNG-powered ships but not retrofit existing ones, as doing so is very expensive. As a result, LNG tends to be introduced in the shipping sector gradually, as new LNG-powered ships come into service. The demand for LNG as a fuel for maritime transport is thus increasing at a sustained but gradual rather than abrupt pace, allowing time for the parallel development of the necessary infrastructure (notably SSLNG) and avoiding the demand for marine fuel acting as a source of volatility in the global LNG market. In some regions, such as Northern Europe, this infrastructure is already at an advanced stage of development.
LNG as a road fuel
Natural gas is already a common fuel for road transport in the form of compressed natural gas (CNG). More than 25 million of these vehicles are currently on the road worldwide, mostly small vehicles. The use of LNG as a fuel for road transport (mainly trucks and coaches), on the other hand, is new, but is expected to increase in the coming years as the market is growing rapidly. The technology has been mastered and most truck manufacturers offer it in their catalogues. The most recent models of these trucks have a range of more than 1 500 km.
This development stems from public authorities’ support. They organise the deployment of LNG filling stations networks and encourage, through advantageous taxation, transporters to opt for LNG vehicles rather than diesel. China, for whom the deployment of LNG as a road fuel is a central element of its energy strategy, is by far the most advanced country, with more than 90% of the world's LNG vehicle fleet. The USA and EU are also fostering LNG adoption for road transport.
For freight operators, the main reason for choosing an LNG rather than a diesel truck is financial. In most countries, LNG enjoys favourable tax treatment. In the EU, the rate of excise duty on LNG is on average four times lower than on diesel; in energy equivalent, LNG costs on average around 50% less than diesel. Thus, while an LNG truck is more expensive to purchase than a diesel truck, these significant fuel and operating savings make it possible to recover the initial extra cost in two to three years.
The reason for this advantageous treatment of LNG is environmental, since trucks equipped with LNG engines produce much less NOX and particles than diesel engines, and above all 20% less CO2 emissions, according to industry figures. Moreover, LNG engines are significantly quieter than diesel engines. However, independent studies have challenged the figures put forward by the industry and stressed that the reduction in greenhouse gas emissions from LNG is only real if best practices are applied throughout the LNG supply chain (no losses, etc.).
Geopolitical and security issues related to LNG
The North Dome/South Pars gas field
The North Dome (Qatar)/South Pars (Iran) gas field is the biggest in the world, with reserves representing 8-10% of all known reserves worldwide. It lies under the Persian Gulf between Qatar and Iran. Numerous regional tensions and the Hormuz straits chokepoint make the Persian Gulf a key zone for the equilibrium of the global LNG market.
Exploitation by Qatar allowed the country to become the n°1 LNG exporter between 2006 and 2018. Iran and Qatar are exploiting the field without a common strategy, which means that the production rhythm is not optimised and what each country will recover in the end will depend on accumulated production. This leads to a strong conflict potential, as Qatar started large-scale production in 1989 while Iran began in 2002 only and, because of the international sanctions, on a much smaller scale.
The North Dome field is Qatar’s biggest source of wealth. Its offshore production facilities as well as the export route through the Strait of Hormuz expose it to a position of strategic weakness vis-à-vis its Iranian neighbour in case of conflict. It is therefore understandable that Doha's policy in recent decades has been based on a search for a balance between assistance and military collaboration with the United States and maintaining a prudent attitude towards Iran by preserving the economic and cultural links between the two countries.
Qatari LNG is currently in a new expansion phase, with new construction projects aimed at increasing LNG production capacity to 110 million tonnes per year by 2024 and 126 million by 2027. A revitalising of the sector coinciding with increased global competition (Australia and USA) and a diplomatic crisis with the alliance between Saudi Arabia, the United Arab Emirates, Bahrain, and Egypt against Qatar.
In Iran, South Pars development has been aimed at domestic consumption. Several export projects have been conceived over the years but due to the difficult international context, none has been implemented. The participation of international partners in the exploitation has been limited for the same reasons. However, production has gradually increased, and Iranian authorities claim it has reached the same level as Qatar.
Securing maritime flows: the strait of Hormuz and other chokepoints
There are several liquefaction units in the Persian Gulf (in Qatar, Abu Dhabi, Dubai, Kuwait). Free movement across the Strait of Hormuz is a fundamental condition for the use of all these facilities. More generally, the Strait of Hormuz, approximately 275 km long and between 50 and 80 km wide, is an eminently strategic passage for the world maritime transport of hydrocarbons. The closure of the Strait of Hormuz would have disastrous consequences on the economies of the Persian Gulf producing States which, deprived of this outlet, would be forced to reduce their exports of energy resources. For this reason, the threat of closure of the strait is a weapon regularly used by the Iranian authorities during phases of tension, particularly vis-à-vis Saudi Arabia and the United States. For Qatar, which has 100% of its LNG exports through the Strait of Hormuz, such a blockade would represent a catastrophe.
In addition to the Strait of Hormuz, other maritime crossing points can have a major strategic impact on LNG trade, in particular the Gulf of Aden and the Red Sea (with the Suez Canal), and the Strait of Malacca (fastest crossing point between Qatar and major LNG importers such as Japan, South Korea and China).
Emergence of new players and strategic competition
The EU is currently the world's largest importer of natural gas (321 Gm3 in 2018) and China the second largest (122 Gm3 in 2018). The question of the evolution of their demand will therefore be a determining factor in the dynamics of LNG trade. Various factors may influence their demand for natural gas, but two more specific variables should be mentioned:
The question for the EU is whether it can achieve carbon neutrality by 2050, which would result in a significant reduction in its gas demand.
For China, it will be important to determine whether natural gas in the context of a climate policy can be, at least in the medium term, a transitional energy.
Influence of major consumer countries
China's growing dependence on natural gas and LNG imports
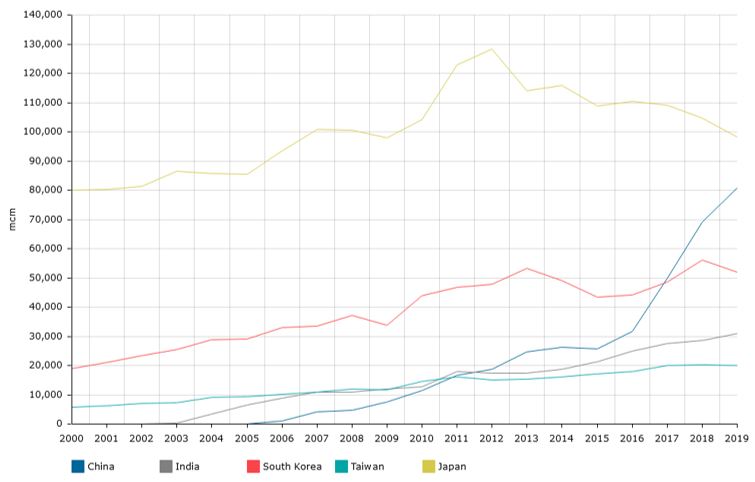
China's dependence on natural gas imports has increased significantly. In 2018, they accounted for 43 percent of its consumption, up from being self-sufficient until 2007. Despite the anticipated increase in production, the share of imports in total consumption should continue to grow.
Figure 3: Evolution of natural gas production and consumption in China in bcm, 2000-2019
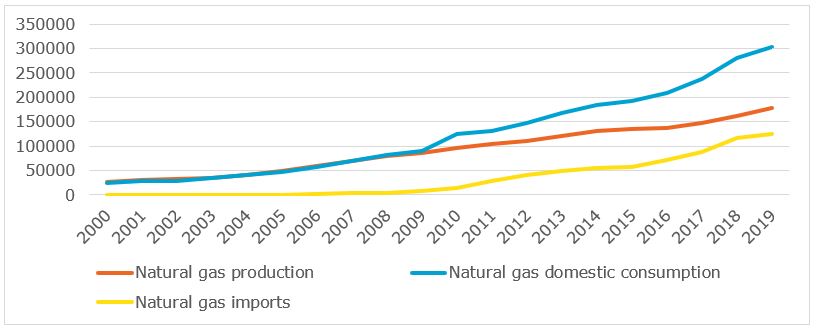
Source: Enerdata, Global Energy & CO2 Data
To secure its gas supply, China seeks to diversify suppliers and supply routes (gas pipelines versus LNG). China's LNG import capacity is around 118 billion cubic meters for imports of 75.5 billion cubic meters in 2018, and by 2024, it could become the world's largest importer of LNG, ahead of Japan.
Diversification of European gas supply as a tool for energy security in a liberalised market
Natural gas covers 23% of the EU primary energy consumption. As gas production in the EU (Netherlands, United Kingdom) has continued to decline, imports have risen, with a current dependency rate of around 60%. Gas should continue to play an important role in Europe's energy balance in the mid-term before experiencing a sharp decline after 2040 as the EU strives for 2050 carbon neutrality.
One of the major challenges for the EU in the context of a liberalized market is its gas security. Traditionally, the EU's natural gas supply has been ensured by an oligopoly of suppliers consisting of Russia (Gazprom), Norway (Statoil) and Algeria (Sonatas). LNG supply from Qatar was added to this supply in a second phase. The security issue is all the more important since in 2030 its gas dependency could be close to 90%. The question of the "Russian risk", i.e. Gazprom's market share in Europe and the geopolitical risk it would generate, is highlighted as one of the most significant. That’s why the EU is now seeking to diversify its suppliers, partly by pipeline, but mostly through LNG and the creation of a significant regasification capacity in the order of 205 Gm3/year.
Table 2: EU regasification capacities in bcm, 2018
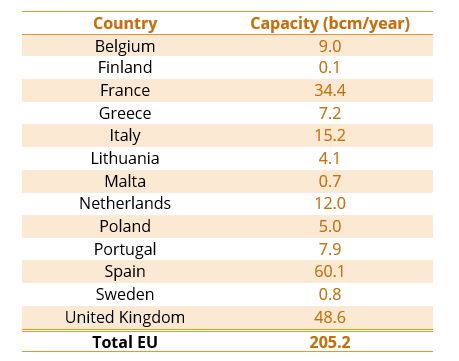
Source: Enerdata, World LNG Database
Russian exports: Europe versus Asia?
Thanks to its considerable reserves, Russia is the world's second largest producer of gas, behind the United States, with a production of 669.5 Gm3 in 2018. The Russian gas industry is dominated by the Gazprom holding company, which holds 70% of total reserves and accounts for 72% of total production, i.e. 499 Gm3 in 2018. The company also has a monopoly on gas pipeline exports but, as of 2014, no longer on LNG exports.
Faced with the globalisation of natural gas markets, Russia’s main challenge is diversifying its export markets. This is closely linked to the evolution of the relations of Russia and its energy companies with the EU. Thus, Europe's desire to diversify its gas suppliers in a liberalized market leads Russia to develop a logic of securing its markets and the demand addressed to it.
This diversification policy is based on the development of an LNG industry, which is the only way to position Russia as a key player in the global natural gas market. Russia produced around 30 Mt of LNG in 2019, i.e. around 9% of global LNG supply. But its objectives are ambitious: it aims for an LNG production of 120-140 Mt/year by 2035, which would put it among the world's top five LNG producers. LNG exports are thus increasingly becoming an integral part of Russia's gas policy. For the moment, they are mainly handled by Novatek (and Gazprom from Sakhalin) and mainly destined for Asia. They also concern the European market, but to date for small quantities.
As China’s gas imports grow, competition between the EU and China for Russian gas supply could develop. Russia would then be in a position to arbitrate between the Chinese and European markets according to price differentials.
The emergence of a US-Russia confrontation on the European market?
Gas diversification in the EU aims to reduce the possible market power of a supplier and thereby ensure its gas security. The biggest concern is Russia (Gazprom), who, with a 30% market share, could be in a position to change the conditions of competition. In this context, LNG as a whole and more specifically American exports (from the large-scale development of shale gas) appear to be an alternative to a significant part of Russian gas supply.
To counter or delay the arrival of new entrants, the Russian gas company has made significant adjustments to its export strategy, particularly its contractual pricing policy. An enduring comparative advantage is also its low delivery costs to Europe (less than US$4/MBtu, compared to between US$5.7 and US$6.4/MBtu for US LNG).
Possible consequences of US-China relations on US LNG exports
Given the changes in Asian demand, transport costs and an initially higher Asian spot price compared to Europe, US LNG exports were in theory mainly destined for Asia and the Chinese market. However, economic factors have called into question the competitiveness of US LNG exports to Asia, particularly compared to exports from Qatar or Australia, or even LNG from Novatek (Russia), and therefore reduced their importance:
- A significant drop in gas prices in Asia,
- Lower gas demand than initially envisaged, particularly in China, and
- a Chinese access to Russian gas with the commissioning of the Power of Siberia in December 2019. Gazprom is thus presenting itself as a new competitor on the Chinese market.
The trade war between the two countries also affected US LNG exports to China. The significant increase in customs duties on American LNG (25%) undermined their competitiveness compared to other sources of supply. However, the trade agreement signed in early January between the two countries could change this situation. It provides for significant purchases by China of American energy products. While the 25% tariff still seems to be in effect for the time being, the consequences on Chinese imports of American LNG could be significant.
Take-aways:
- The global LNG market is expanding rapidly, already accounting for 45% of natural gas trade worldwide, and it is expected to more than double by 2040 to 729 bcm, which would bring the share of LNG in world gas trade to almost 60%.
- This growth is buoyed by several technological innovations lowering the environmental impact of the sector while offering more flexibility and cheaper investments costs for capacity building.
- Beyond traditional natural gas uses, new markets are growing fast, particularly the use of LNG for maritime and road transport.
- Energy security is a key part of national energy strategies. LNG plays an important role in diversifying natural gas suppliers, thus reducing countries dependency on their traditional gas suppliers.
- The natural gas sector is not exempt from geopolitical issues, with major gas fields in troubled regions (cf. North Dome/South Pars). Securing LNG facilities and routes is also a major challenge.
- Negative consequences of the Covid19 pandemic on LNG markets are likely in the short-term but remain to be assessed.
This Executive Brief stems from an analysis by Enerdata, the French Institute for International and Strategic Affairs (IRIS) and Cassini for the French Ministry of Defence (full report available in French here).
Annex: technological developments (FLNG, FSRU, small scale LNG)
Several recent technological innovations have contributed to the expansion of the LNG market worldwide and offer significant growth prospects.
Floating storage and liquefaction facilities (FLNG for Floating LNG)
Conceptualised in the 1970s but developed in the 2000s, FLNG enables the development of natural gas resources at sea without having to go through onshore liquefaction terminals. Floating above an offshore natural gas field, the FLNG installation makes it possible to produce natural gas, liquefy it, store it and finally transfer it in the form of LNG (as well as potentially LPG and condensates) to LNG carriers directly tied up to the production and storage vessel.
The benefits are a lower environmental impact, reduced investments, quicker and better implementation deadlines, possibility of innovative financing solutions, flexibility and mobility, and political and geopolitical advantages (FLNG makes it possible to limit operators' interactions with local populations, whose relations may be conflictual).
Floating storage and regasification facilities (FSRU for Floating Storage and Regasification Unit)
FSRUs are floating facilities for the storage and regasification of LNG and operate almost identically to onshore facilities. They offer the same advantages as FLNG. By offering a quick solution while waiting for the construction of an onshore terminal, the FSRUs help rapid expansion projects.
Platform LNG (PLNG)
The idea of installing liquefaction terminals on platforms (fixed to the seabed) rather than on ships also exists but has not yet been implemented. Indeed, this option could be relevant wherever it is difficult to build onshore facilities, for example in remote, unstable, or environmentally sensitive areas.
The miniaturisation of LNG facilities: SSLNG (Small Scale LNG)
Since the beginning of LNG development in the 1960s, the size of the facilities has grown steadily due to the significant economies of scale at work. However, new environmental (linked to the low polluting emissions of natural gas in general), economic and security of supply issues have recently revived interest in SSLNG (facilities producing less than 1 Mpta of LNG and with storage capacities of less than 30,000 m3) compared with conventional LNG (where liquefaction trains generally reach between 5 and 8 Mtpa). This new market is in full expansion and could represent nearly 100 Mtpa by 2030 (1/4 for electricity production, 1/3 for maritime fuel and around 40% for road fuel).
The modular and scalable design of the projects makes it possible to overcome the lack of economies of scale: the size of SSLNG facilities can thus easily be increased in the event of growing needs, which represents an investment flexibility that is highly valued by operators. SSLNG is widely used for peak load curbing and smoothing short-term fluctuations in consumption.