See also
Webinar - Electricity Prices: A Risky Future?
The photovoltaic (PV) market is currently at a turning point, facing diverging and complex influences. While the levelized cost of electricity (LCOE) for solar PV is stagnating or increasing and public tender volumes are shrinking, solar capture rates are steadily declining due to the growing penetration of renewables in a sluggish demand context.
Why hourly price projections matter and what drives them?
Request the publication (Free)
The 2021–2022 energy crisis served as a significant wake-up call for the European power market. Record-high power prices led to bankruptcy of several power system actors that had insufficiently secured their supply. Suppliers and large consumers showed a renewed interest in long-term hedging through Futures, Power Purchases Agreements (PPAs) or other bilateral agreements.
By 2025, while long-term electricity prices returned to pre-crisis levels, the market entered a “new normalcy”. This era is defined by a growing divergence in price extremes – marked by more frequent negative prices during renewable peak generation and intensified price spikes during periods of system stress- and overall increased unpredictability.
In this context, stakeholders increasingly need tools able to anticipate not only average price levels, but also the frequency, magnitude and duration of extreme price events — gaps that traditional forward prices fail to address.
This analysis explores the necessity of closely monitoring hourly power prices for:
- financial actors assessing risk exposure,
- power producers managing revenue and capture price uncertainty,
- energy aggregators managing multiple assets with cumulating revenue streams,
- large electricity consumers securing long-term procurement costs,
and demonstrates how Enerdata’s Power Price Projections (PPP) address these challenges.
The necessity for power price forecasting
Accurate price forecasting is essential for all stakeholders in the power system value chain: suppliers and consumers need to forecast the cost of covering their future demand and implement effective hedging strategies, generators and aggregators require revenue projections for existing assets and long-term forecasts to inform investment decisions in new capacity.
In Europe, power is traded via markets (Futures, Day-Ahead, Intraday) or bilateral agreements (PPA, OTC1, CfD2, …). The Day-Ahead (DA) Spot price serves as the primary price reference for the entire industry. DA Spot prices are defined at Bidding Zone level. Most bidding zone coincide with national borders, though countries like Italy, Denmark, Norway, and Sweden are split into multiple zones. DA Spot prices are cleared via the Single Day-Ahead Coupling (SDAC) process - which includes an allocation of cross-border transmission capacity-resulting in distinct prices across all bidding zones. Since September 2025, the Day-Ahead market has moved to 15-minute intervals to better integrate renewables and foster flexibility uses3. The DA Spot price serves as a reference for PPA negotiations. It also influences Future Calendar price.
Exposure to DA prices — even marginal — can disproportionately impact total procurement costs. In 2022, a high price period on the DA, suppliers who had hedged 90% of their needs through Futures and bilateral agreements found that covering the remaining 10% on the DA (and Intraday) market(s) could account for up to 95% of their total procurement cost.
While Future markets yield some indication of future power prices, they fail to correctly capture the temporal structure of prices — which ultimately drives value creation for the market player. Calendars give little information regarding power price evolution in a distant future. Amongst the Future Calendar products, that span from Y+1 to Y+10, the liquidity is concentrated only on the oncoming next three years (e.g. Calendar Y+1 represented 75% of the Calendars traded in Germany between 2020 and 2024). Moreover, Calendar products lack granularity. Sold under two product types: a Calendar Base load or a Calendar Peak - which consist in a constant power output respectively throughout the year or between 8am and 8pm on weekdays throughout the whole year-, it masks the hourly variability of the DA Spot price.
Several factors are fundamentally altering market power price patterns.
The increasing penetration of renewable capacities, especially solar, leads to lower captured price. This cannibalisation effect is rapidly gaining momentum. In Europe, there are 400 GW of installed solar capacity, and an additional 60 GW are expected by 20304.
Since solar generation peaks simultaneously across large geographical areas, it shifts the merit order curve5 towards lower prices, resulting in a price captured lower than the average market price. Large addition of solar generation will decrease even more the capture price for renewable owners.
As the share of renewable in the power mix increases, the uncertainty borne by weather conditions (solar, wind, hydrological precipitations and temperature) translates into a growing uncertainty on the actual renewable generation level. Since meteorological patterns vary hourly and yearly, it introduces a greater uncertainty in generation levels, which in turn broaden the range of possible power prices.
Another uncertainty, that applies on a longer time scale and could have great impact on Spot power prices, is the ongoing reform of the European Trading System (ETS) market. The revision of the Market Stability Reserve (MSR) could lead to very distinct carbon price trajectories (more details available in Enerdata brief: Carbon Price Forecast 2030-2050: Assessing Market Stability & Future Challenges | Enerdata). This would affect the marginal cost of all carbon-intensive generation, mostly thermal power plants, which often are marginal in today’s power system. Carbon price has a dwindling effect on power price on the longer term as more generation becomes carbon-free. However, the remaining few carbon-intensive power plants will face increased marginal price. As they are used less often, likely only in last resort for the system security, it will lead to a concentration of high-price periods.
Finally, demand transformation also encompasses a lot of uncertainty, on the total annual demand but also the shape and peak values. Demand level is a key determinant of the DA Spot price. And future demand will be influenced by many different drivers: the pace of electrification (EVs, heat pumps, industries electrification), the development of the hydrogen economy, the demand-side flexibilisation. Not only is demand harder to forecast, but its evolution is also interlaced with other energies.
Together, these drivers do not merely increase uncertainty — they structurally widen the distribution of hourly prices, making average prices increasingly poor indicators of the valuation of assets.
A model to navigate the complexities of the modern power landscape
Leveraging on a 30-year of expertise in global energy modelling and monitoring, Enerdata has developed the Power Price Projections (PPP) service to help market participants navigate the complexities of the modern power landscape. The PPP provide hourly DA Spot price forecasting across 34 European bidding zones, with a projection horizon extending to 2050.
Unlike most power market approaches that focus on electricity only, PPP is explicitly designed to capture the structural variability of power prices and the resulting value creation for stakeholder, while using a global approach encompassing energy demand evolution, regulatory risks (e.g., EU-ETS, national policies), multi-energy impact, and non-European countries influence.
Our PPP use an in-house model built upon the open-source python package PyPSA. It accurately simulates the SDAC process by following a similar merit order logic. The model, through an optimisation-based approach that minimizes total system operational costs, dispatches the least expensive technologies first, effectively reproducing real-world market dynamics.
While the SDAC has recently transitioned to 15-minute intervals, the PPP’s model operates on an hourly timestep over a full year. This granularity helps keep in check the model size for computational efficiency reasons while still capturing the hourly volatility of renewable generation, fluctuating demand, and the crucial role of flexible assets -such as battery storage and pumped hydro-.
A model integrated in a global energy data ecosystem
The strength of the PPP lies in its integration within the Enerdata’s ecosystem, using the products EnerFuture, Power Plant Tracker, Global Energy and CO2 Data and Carbon Price Projections.
To enhance power prices realism, the model uses a unit-level representation and heuristic-based bidding strategies. The Power Plant Tracker database allows the modelling of thermal power plants at unit-level and the incorporation of technical commitment constraints (such as minimum stable generation and minimum up/downtimes). Combined with a heuristic pricing strategy, the approach yields results significantly closer to actual market behaviour than standard dispatch models.
PPP’s main inputs (demand, generation, commodity prices) are derived from EnerFuture, Enerdata’s global multi-sectoral multi-energy model based on POLES.
Scenarios from EnerFuture were adapted to shed light on contrasted pathways of power demand and generation evolution. The two most representative EnerFuture scenarios were modelled: EnerBase and EnerBlue. These scenarios respectively assume: the continuation of existing policies without further climate ambition (EnerBase), and compliance with the 2024 Nationally Determined Contributions (NDCs) to reach net-zero by 2050 (EnerBlue).
In addition, a third Central scenario is implemented, reflecting a delayed demand electrification compared with official targets and a capacity development in between EnerBase and EnerBlue. The Central scenario is designed to represent a transition pathway more representative of recent trends.
In EnerFuture, the energy demand results from assumptions made on the global macroeconomic development and can be met through multiple energy vectors. It reflects real-life arbitrage that is made between electrification and alternative choices (e.g., sufficiency, biomass, natural gas…). Annual power demand modelled in EnerFuture is usually lower than projections made by national entities in charge of power network planning, and it can be explained by increase recourse to efficiency and sufficiency measures.
Furthermore, the PPP integrate Enerdata’s Carbon Price Projections to address regulatory uncertainty surrounding the EU-ETS and MSR reforms. By offering three distinct carbon price trajectories, a robust sensitivity analysis can be conducted to measure how varying carbon costs will impact marginal generation, power prices, and, ultimately, the captured prices for all market actors.
A glance at future trends of power prices
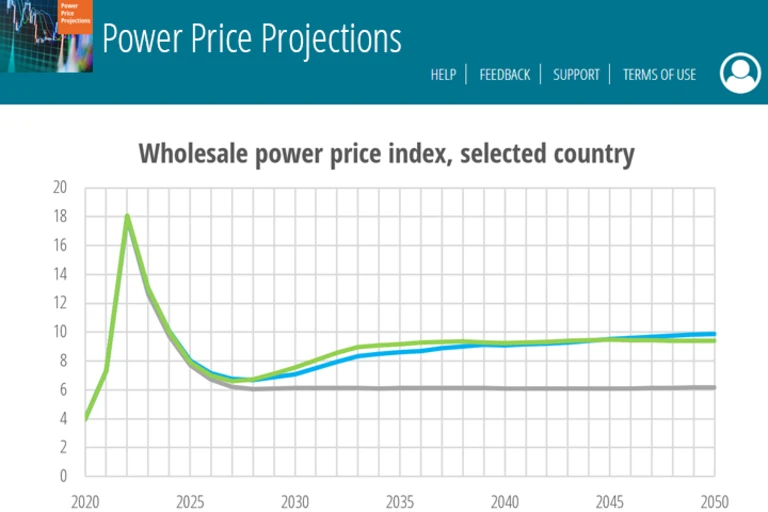
Power prices trajectories differ between the scenarios studied, either driven by additional generation capacities, a stagnating demand or increasing carbon prices. In the Central scenario, prices remain below the other two scenarios until 2040 before gradually catching up with the prices in the EnerBlue scenario. This is explained by a transition period of overcapacity in the Central scenario that pushes prices down (generation capacities ramp up while the demand stagnates and then picks up only after a few years). From 2040 onwards, rising carbon price drives the least decarbonised scenario, EnerBase, toward higher values.
These trajectories show that market players should closely monitor evolution of electricity demand (for its short-term effect on prices) and the ongoing reform of the ETS market (for its effect on long-term prices).
Figure 1: Monthly Power Price Projections
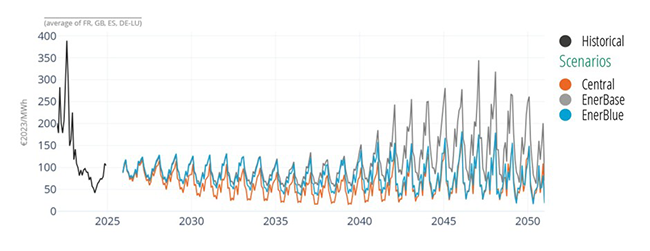
Source: Enerdata, own analysis from Power Price Projections
Hourly prices will likely exhibit longer periods of extreme values, both high and low. Additionally, the peak prices will progressively increase. In the EnerBase scenario, prices diverge intensifies, with a widening spread and higher volatility from 2030 to 2050. In the EnerBlue scenario, where the decarbonisation targets are the most ambitious, the frequency of low-price hours explodes by 2050, accounting for up to 50% of occurrences throughout the year.
For market players, it means that cost or revenues from supplying or providing power will be driven by a shorter amount of hours, with a higher risk exposure.
Figure 2: Power Price Projections Distribution
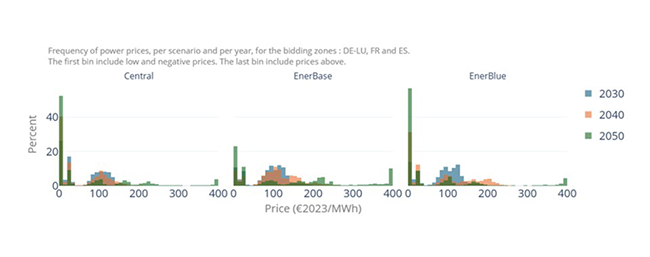
Source: Enerdata, own analysis from Power Price Projections
Solar capture rates progressively decline, especially in the summer months, and the trend accelerates as solar generation ramps up by 2050. The phenomenon is most stark in Germany (DE-LU bidding zone) where the summer months, pictured here with darker colours, capture a lower-than-average monthly price. In France, the solar capture rate gradually spreads over the months as solar becomes a more important source of generation.
This highlights the growing need for granular price forecasts when structuring merchant or partially hedged solar projects.
Figure 3: Monthly Solar Capture Rate Projections
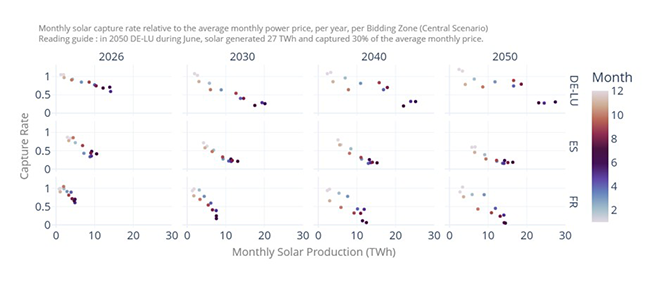
Source: Enerdata, own analysis from Power Price Projections
Conclusion – Why hourly price projections matter?
As European power systems transition toward higher shares of renewables, assets value becomes increasingly driven by hourly dynamics rather than average price levels. Extreme price events, declining capture rates and growing uncertainty around demand and carbon prices fundamentally reshape risk exposure for all market participants.
In this context, Enerdata’s Power Price Projections provide a model integrated in a global energy data ecosystem to assess future power price trajectories at an hourly resolution, across contrasted transition pathways. By combining detailed power system modelling with a multi-energy and multi-scenario approach, Power Prices Projections enables stakeholders to better anticipate risks, optimise hedging strategies and support investment decisions in an increasingly complex market environment. Additionally, Enerdata can also deliver tailored analysis reflecting price sensitivity to various events (dunkeflaute, new gas crisis, lack of rain, delays in expected constructions…) and to your specific needs.
Notes:
- OTC: Over-the-Counter bilateral agreements, where power is traded directly between parties (e.g. traders, aggregators, suppliers, large consumers or generators) via custom contracts.
- CfD: Contract for difference, a long-term contract where a generator is offered a fixed price for its generation, while the counterparty (often the government) pays/saves the difference between the agreed price and the market price. This type of contract is often used to support renewable projects by reducing the price risk.
- 15-minute products in Market Coupling | EPEX SPOT
- Solar Power Europe, EU Solar Market Outlook 2025-2030.
- The merit order is a curve constructed by stacking power plant supply offers by increasing order of marginal cost. It determines the dispatch priority on the market. This ensures that the least expensive generation, primarily renewables, is dispatched first. The market clearing price is the marginal cost of the last power plant needed.