See also

Carbon Market Assessment
Breakdown of carbon markets and evaluation of the climate change impacts on the carbon price.
What future for emission trading in the EU?
Request this executive brief in pdf format (FREE)
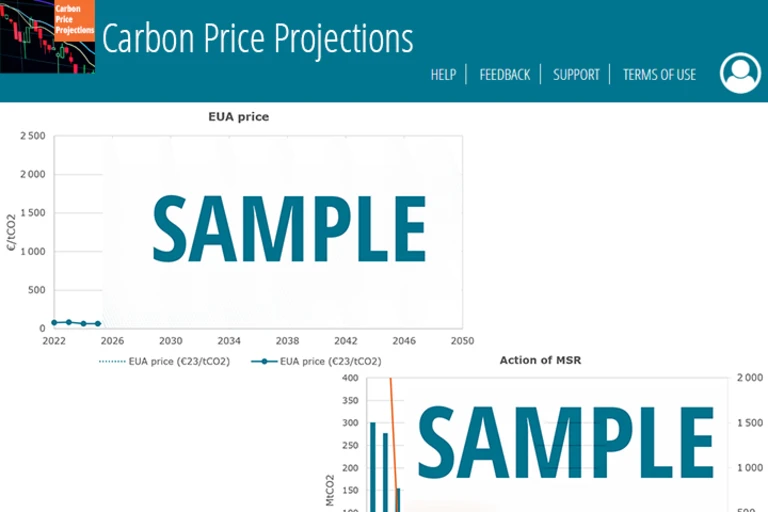
2026-2027: critical milestones ahead for European carbon markets
The EU ETS has been introduced in 2005, marking a first step towards the use of carbon pricing instruments as part of the EU policy setting towards decarbonisation. Since then, the EU ETS has seen its design adjusted to correct its initial flaws and to adapt to a changing environment. It has allowed to reduce the emissions of regulated entities substantially and is expected to remain at the core of the EU Climate Policy instruments on the roadmap to carbon neutrality in 2050.
In this context, the next two years will be absolutely pivotal for the future of carbon pricing in Europe. First, a revision of the ETS directive and the MSR decision is planned for 2026, opening the way to a reform of different aspects of the EU ETS with regard to its future ambition, scope and design. Then, the second emission trading scheme covering the road transport and buildings sectors should start operating in 2027, with uncertainties as to the value at which ETS2 allowances will be auctioned and traded. Although ongoing trilogue discussions are even considering postponing the ETS2 start to 2028, this analysis takes into account the objectives as they are currently enshrined.
After a recap of the history of the EU ETS, our analysis aims to provide perspective on these turning points for the EU carbon pricing, first discussing the uncertainties related to the EU ETS and its upcoming reform, and then focusing on the ETS2 and providing our first expectations for its price trajectory.
Rewinding two decades of EU ETS: market design and operations
The EU ETS market: a cap-and-trade system supporting decarbonisation in the EU
The EU ETS operates in all EU Member states plus Iceland, Liechtenstein, and Norway since 2005. It is also linked to the Swiss ETS since 2020. The system covers emissions from the electricity and heat generation sectors, as well as in manufacturing industry, aviation (since 2012) and maritime (since 2024). It accounts for around 40% of the EU’s emissions. Over the years, the EU ETS has undergone several revisions, aligning the system with the strengthened EU climate targets. In 2023, the emission cap has been tightened to - 62% by 2030 compared to 2005 levels, in order to align with the Fit for 55 package.
The EU ETS is based on a ‘cap and trade’ principle. A cap is a limit set on the total yearly amount of greenhouse gases that can be emitted by the installations and aircraft operators covered. Every year, allowances are traded on a common market, which allows for the formation of a carbon price. Since the volume of allowances available on the market is due to decrease over time, emissions will have to be reduced, ensuring that the emitters are compliant.
A share of the allowances is allocated for free, mostly to industrial actors, to prevent risks of carbon leakage1 and preserve the EU’s competitiveness. The remainder is allocated through regular auctions held by Member States. Historically, international credits could also be surrendered in place of EU allowances, although this effect has become marginal since 2015, and stopped from 2022 onwards.
In 2019, the EU ETS was complemented by the introduction of the Market Stability Reserve (MSR).
The Market Stability Reserve: an instrument to ensure market stability
The MSR was originally implemented to provide more stability to the EU ETS market by balancing the supply and the demand of EUAs. Each year, the Total Number of Allowances in Circulation (TNAC) in the system is calculated. If this number exceeds a ceiling value (833 MtCO2, the “upper threshold”), the auction volume for the following year is adjusted downwards, thanks to the MSR, which will intake 24% of the year's surplus (12% after 2030). Conversely, if it is below a floor value (400 MtCO2, the “lower threshold”), 100 MtCO2 of allowances are released from the reserve into the market, within the limit of what is available in the reserve. Both thresholds are therefore supposed to represent a “healthy surplus” for the system: when TNAC is calculated between the thresholds the MSR remains inactive, when it is above the thresholds, the MSR helps to stabilise the market by ensuring a satisfactory adequation between the supply and the demand of quotas.
In 2024, an upper buffer was implemented: if the year’s surplus is between 833 MtCO2 and 1096 MtCO2, the difference between the surplus and 833 MtCO2 will be absorbed (instead of 24%). The buffer was added to smooth the response of the MSR when the TNAC is close to the upper threshold and prevent from observing a threshold effect.
Finally, since 2023, the maximum amount of allowances within the MSR has been capped. Therefore, each year the exciding allowances on December 31st are invalidated, in order to maintain a maximum of 400 MtCO2 in the MSR on January 1st.
Twenty years of market operations
The EU ETS started operating in 2005, with a cap set at about 2,200 MtCO2, for stationary installations only. Since then, the cap has decreased to around 1,450 MtCO2 in 2024, despite including the intra-EEA aviation sector in 2012, which led to a punctual increase in the cap.
In practice, emissions have decreased faster than the cap: they reached the maximal amount allowed by the cap only in 2007 and 2008. Since then, they stand significantly below the cap. This, along with the abundance of international credits being used in the system up to 2014, led to a situation of oversupply in the market. As illustrated on Figure 1, the TNAC (also referred to as surplus), rose quickly over 2008-2013 to reach 2,100 million EUAs, more than a full year worth of emissions. Incidentally, the EUA price (shown on Figure 2) failed to reach a sufficient level to incentivise decarbonisation.
Figure 1: Historical EU ETS operations – EUA supply, verified emissions, cap, and surplus
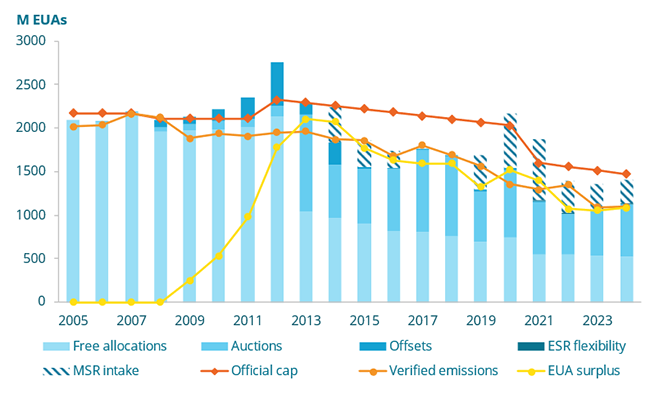
Source: Enerdata, Carbon Price Projections
The MSR has notably been introduced to address this excess of allowances that had been accumulated in the system since its creation. 900 million allowances have hence been back loaded to the MSR in 2014-2016, effectively reducing the auction volumes in these years. In addition to this back loading, the cumulative intakes by the MSR since it began operating in 2019 stood at 2,650 MtCO2 as of 2024. This mechanism has therefore prevented the system to be overflooded with EUAs and hence brought the EU ETS to a tighter market. The price has thus started increasing substantially over 2017-2023, reaching above €80/tCO2 in 2023 (yearly average), much stronger incentivizing investments in decarbonisation measures across compliance entities. Since then, the price has slightly decreased but remained between €60/tCO2 and €80/tCO2.
The invalidation mechanism has led, as of 1st of January 2025, to about 3,150 million EUAs being removed from the MSR and invalidated, limiting the amount of allowances in the reserve available for potential future releases to 400 MtCO2.
Figure 2: Historical EU ETS allowance price
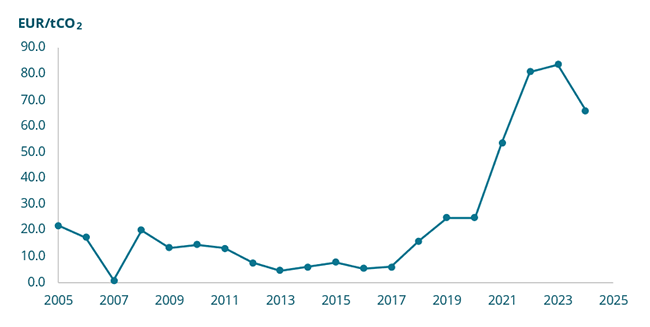
Source: Enerdata, Carbon Price Projections
Uncertainties on the future of the EU ETS: awaiting the 2026 reform
The EU ETS so far seems on track to meet its 2030 emission reduction target of -62% compared to 2005. The longer term is more uncertain, as the EU ETS 2040 emission reduction target has yet to be announced. It should be released with the finalisation of the 2040 climate target, and is expected to somehow align with the EU’s Net Zero 2050 ambition.
Figure 3: EU ETS emissions – Evolution since 2005 and future targets (illustrative)
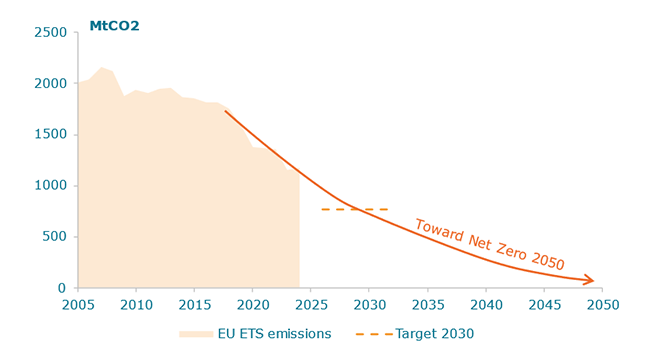
Source: Enerdata, European Environment Agency, EU ETS data viewer
In addition to the promising historical trends described previously, the alignment of the EU ETS with its 2030 emission reduction target should be achieved by construction. Indeed, such ‘cap and trade’ systems are designed to allocate a predetermined number of emission allowances coherent with the ambition. The carbon price then acts as the adjustment variable incentivising regulated actors to decarbonise their activities in line with the overall targets.
To quantify these price impacts, Enerdata modelled2 the EU ETS and the MSR mechanism using the POLES-Enerdata model, and produced its own carbon price forecast up to 2050. The cap used in the modelling was assumed to reproduce the European Commission’s official LRF3 up to 2030, to then slow down and follow a linear decrease toward Net Zero by 2050. In the core scenario, 150 MtCO2 of Carbon Dioxide Removals are assumed to be added to the cap by 2050. To deal with the uncertainties around the expected development of removals, and quantify their impacts on the market price, a sensitivity analysis was performed: +/- 50 MtCO2 around the main hypothesis in 2050.
The projections assume no change in the current EU ETS and MSR designs, to give a picture of the pre-reform situation. The sensitivity analysis leads, in projection, to a price4 that rises from €75/tCO2 in 2025 to a €400-630/tCO2 range in 2050. In all trajectories, the increase is moderate on the short-medium term, but accelerates after 2035, until a peak around 2045. After then, as the system only has to cover low emissions, the carbon price is mainly driven by the cost of removal technologies, leading to decreasing price trajectories.
Figure 4: EUA price forecast – Current ETS and MSR design – removals sensitivity range5
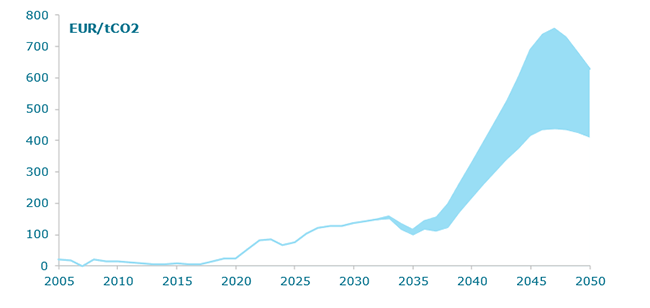
Source: Enerdata, Carbon Price Projections
The MSR behaviour can explain some aspects of the price trajectory. Indeed, in our core scenario, the TNAC decrease leads to two 200 MtCO2 releases in 2037-2039 and 2041-2043. These releases, and the anticipation of these by compliance entities, help to limit the price increase in the short-medium term by sustaining market liquidity.
After 2043, the MSR is empty, and cannot mitigate the market’s allowances scarcity any more. Hence, the faster price increase in the end of the period that - as the model assumes some form of anticipation by actors - starts as soon as 2038.
Figure 5: TNAC, MSR thresholds and MSR action
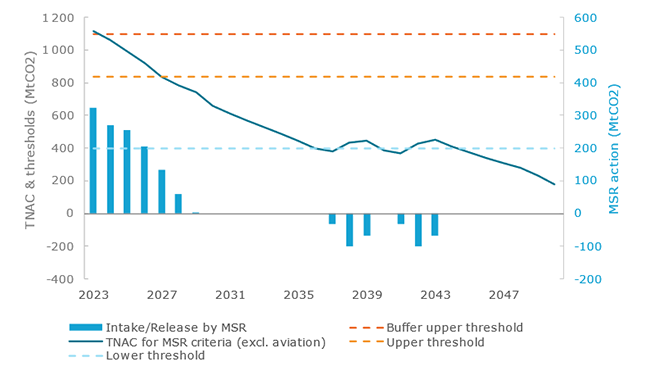
Source: Enerdata, Carbon Price Projections
In any case, the steep increase of the price in all the trajectories, as well as the emptiness of the MSR after 2045, show the need for a revision of the EU ETS design. Indeed, as previously mentioned, the intrinsic nature of the system makes it effective to reduce emissions, but it shouldn’t be at the expense of actors. Moreover, the MSR should be able to be resilient to unexpected supply-demand imbalances, a purpose its lack of allowances in the long run prevents from fulfilling.
The 2026 revision of the ETS Directive and MSR Decision is precisely expected to induce significant changes in the ETS and MSR designs, to prepare for the next decades where the ETS will switch to a situation of allowance scarcity. To begin with, the reform is likely to introduce some structural changes regarding the cap and the scope of the market. The currently legislated cap trajectory would reach zero emissions around 2040, a timeline judged unrealistic by a majority of stakeholders. A change in the cap is therefore expected and should also depend on the final 2040 climate target under finalisation. In addition, there are multiple question marks with regard to the EU ETS scope. The question of how extra-EEA aviation emissions will be accounted for after 2027 and the end of the “stop the clock” mechanism is on the table. The inclusion of additional sectors related to waste and CCU is being considered, as is the option to introduce removals into the system, with different possible ways and volumes. Finally, changes in the MSR design are also expected, among which: a possible redefinition of the thresholds, of the intake and release rates, and the suppression of the invalidation mechanism. Some actors even call for a MSR based on price-based criteria, or the establishment of a European Carbon Bank, acting as the European Central Bank but for the ETS market.
All of those possible outcomes contribute to an even broader uncertainty as to the carbon price range in the years to come - as it is illustrated on the figure below - that only the revision will allow to narrow down.
Figure 6: EUA price projections – regulatory uncertainties pending the 2026 reform
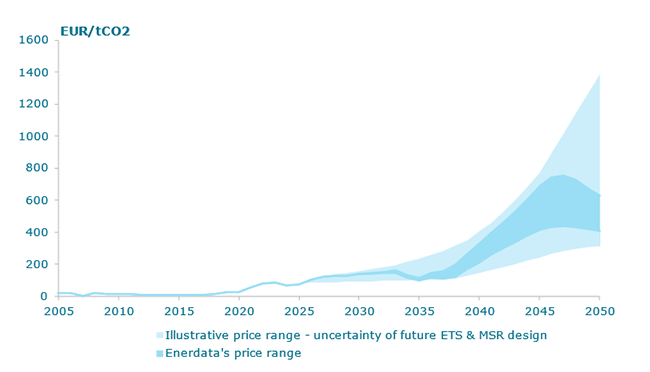
Source: Enerdata, Carbon Price Projections
All eyes on 2027: what price for the start of the ETS2?
A second emission trading system was announced in 2023, to address the emissions of the sectors not yet covered by the first scheme, namely road transport, buildings and small industrial installations. Since 2025, fuel suppliers of the hereby mentioned sectors entered a monitoring phase, and the system should be fully operating in 2027.
Several aspects of the new scheme share similarities with the EU ETS. The ETS2 cap targets a 42% reduction in emissions by 2030, compared to 2005. A second MSR (MSR2) will be implemented in 2027, with a substantially simpler design than that of the EU ETS: upper and lower thresholds at 440 MtCO2 and 210 MtCO2 respectively, no buffer, and both intake and release rates set at 100 MtCO2. Specific to the MSR2, the allowances remaining from the 600 MtCO2 initially filled in the reserve in 2027 will be invalidated in 2031, meaning that, in the event that the TNAC remains higher than the upper threshold from 2027 to 2031 – and therefore no supplementary intake occur -, the MSR will necessarily be empty in 2031.
Although the ETS2 has not entered into force yet, it is possible to establish projections for its operations, and notably its market price. ETS2 Futures contracts have started to be traded on ICE in May 2025 at a price of around €75/tCO2.
Enerdata produced forecasts for the operations of the ETS2 system using the POLES-Enerdata model, with its dedicated ETS2 optimisation module, fully accounting for its market design and based on an explicit allowance supply-demand equilibrium. The price trajectory, along with explanations about the operations of the MSR2, are provided on Figure 7. The 2027 price will be formed in the context of an already quite constrained market. After 2027, the ETS2 price is expected to increase at a moderate pace for around 5 years, with continuous releases by MSR2 enabling to limit the increase in market tension. By 2031, before its historical stock is invalidated, the MSR2 is indeed expected to release 300 MtCO2. After that, the ETS2 price is projected to increase substantially quicker, and to almost double by 2040, compared to 2027.
Figure 7: ETS2 outlook – price forecast6 and MSR2 operations to 2040
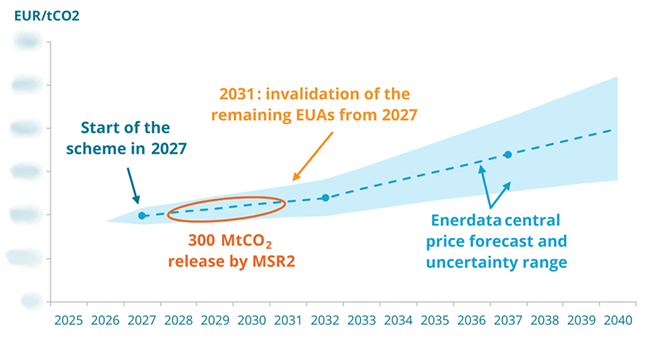
Source: Enerdata, Carbon Price Projections
The decarbonisation of the EU buildings and road transport sectors is indeed a challenge, despite the availability of key technologies such as heat pumps and electric vehicles. The shift from internal combustion engines vehicle to electric vehicle faces some public acceptability issues, and so does the corresponding objective to ban fossil-fuelled vehicles from new sales by 2035. Some delay on the achievement of this objective could be expected. In addition, the inertia inherent to the renewal of the whole fleet prevents emissions from dropping too quickly in this sector.
The buildings sector is also characterized by structural inertia, along with a strong need for complementary support policies to foster energy efficient retrofits. The deployment of heat pumps could play a massive role but is also conditioned by a rate of replacement of existing equipment. With a large share of EU households with limited resources to finance such transformations, the decarbonisation of these sectors is not expected to be quick enough for the ETS2 market not to be tight and its price to be lower.
As previously mentioned, talks about the delay of the start of the ETS2 scheme to 2028 are currently ongoing. On November 13th 2025, the European Parliament voted favourably for the delay, showing - if there were any remaining doubt - the importance of the ETS2 subject and increasing even more the high level of uncertainty regarding its near future.
CONCLUSION
Emission trading, in the form of the EU ETS, has now contributed for two decades to the decarbonisation of the EU economy. Greenhouse gas emissions covered by the EU ETS have indeed been almost halved since 2005, a significant decrease helping to keep the EU on track for its long-term climate commitments.
However, on the pathway towards carbon neutrality, adjustments to the EU ETS will need to be made, in order to adapt its design to a situation of low emission level and increased scarcity of allowances. A revision of the ETS Directive and the MSR Decision is planned in 2026, and these reforms will be defining for the future success of the EU ETS as an instrument of the EU Climate policy. Shortly after the reform, 2027 should mark the launch of the ETS2 market, aimed to cover emissions from buildings, road transport, and industry not yet covered by the EU ETS. This will allow to majorly increase the volume of EU emissions covered by an emission trading mechanism, and once again support the EU climate roadmap to 2050. While some uncertainties remain as to what the expected price level will be on this new market, our estimates show that it could double from 2027 to 2040.
With the upcoming EU ETS reform and the start of the ETS2, the next two years will definitely constitute pivotal milestones for emission trading in Europe. In addition, talks between the EU and the UK on a potential linking between their respective ETS are expected in the coming months, possibly adding to the list of key moments in ETS history. We, at Enerdata, for one, are excited to see how it will unfold and will carefully monitor these developments!
KEY TAKEAWAYS
- Historical EU ETS emissions: 46% reduction in EU GHG emissions in 2024 compared to 2005 levels.
- EU ETS reform in 2026: a revision of the EU ETS is planned for 2026, with expectations for changes in its design to prepare it for a low-carbon and market scarcity compatible future. This reform induces high regulatory uncertainties in the EU ETS outlook and notably price forecasts.
- Launch of the ETS2 in 2027: The new system should start operations in 2027, with uncertainties as to its price. Considering all the variables above, and leveraging the POLES-Enerdata model, we have produced a solid price forecast for the start year, along with a progressively increasing trajectory afterwards.
Notes
- Carbon leakage: transfer of CO2 emissions from one country to another, when companies relocate their production to countries with weaker climate policies and therefore lower emission constraints.
- For more information on the modelling approach, please refer to our Carbon Price Projections service
- Linear Reduction Factor: mechanism used in the EU ETS to determine the emission cap. Unless the LRF changes, the cap is annually reduced by the same amount, calculated as a fixed percentage of an historical reference year.
- Prices in projection are expressed in €2024
- Annual results for the core scenario, and the sensitivity range, are provided as part of our Carbon Price Projections service
- Our ETS2 price forecast is here displayed with 5-year steps. The full trajectory with annual values is available as part of our Carbon Price Projections service.
Previously on this topic - 24 November 2023
Is the current design of the EU ETS suited for post-2030 deep decarbonisation?
The European Union (EU) has set ambitious decarbonisation targets for 2030 and 2050, supported by a range of policy instruments to foster various actors to cut their emissions. One of these instruments is the EU Emission Trading System (EU ETS): a market on which electricity producers and industrial companies pay for their greenhouse gas emissions, therefore generating revenues to finance the EU’s green transition.
The aim of this article is to present how the current structure of the market with the Market Stability Reserve (MSR) works and how it will behave in the future with its current design, by using our POLES-Enerdata modelling tool. The results raise some questions about the value of projected carbon prices in the future and the durability of the current design of the EU ETS.
THE EUROPEAN EMISSION TRADING SYSTEM (EU ETS)
System Overview
The EU ETS operates in all EU Member states plus Iceland, Liechtenstein, and Norway (EEA-EFTA states) since 2005. It covers emissions from around 10,000 installations in the energy sector and manufacturing industry, as well as aircraft operators flying within the EU and departing to Switzerland and the United Kingdom, that represent around 40% of the EU’s emissions.
The EU ETS operates in successive trading phases. The first phases allowed to launch the system and progressively establish its policy framework: obtaining a carbon price, setting emissions caps that are more and more constrained, trading permits across the EU, monitoring CO2 emissions for emitters, opening the perimeter to cover additional emissions in the EU. Over the years, it has undergone several revisions aligning the system with the strengthened EU climate targets (see e.g. the COPEC research programmes for an ex-ante assessments of those legislation proposals). Since 2005, the EU ETS has helped bring down emissions from power and industry plants by 37%. Recently aligned with the Fit for 55 package, the cap on emissions has been tightened -62% by 2030 compared to 2005 levels impulsing additional pressure on emissions.
The EU ETS works on a ‘cap and trade’ principle. A cap is a limit set on the total amount of greenhouse gases that can be emitted by the installations and aircraft operators covered. Every year, emissions must be covered by the same amount of permits. Since the volume of permits is due to decrease over time, emissions will have to be reduced ensuring the emitters to be compliant. At the beginning of the Phase 3 in 2013, a global cap was set with on the basis of the average total quantity of allowances issued annually under Phase 2 (2008-2012). This amount decreased annually by the linear reduction factor of ‑1.74 % in Phase 3 (2013-2020). The system is now in its fourth trading phase (2021-2030), with a 2021 cap set at 1,572 Mt for stationary installations and an LRF strengthened to ‑2.2% that means the cap decreases by 43 Mt each year. With the Fit for 55, the LRF will be -4.3% (i.e. -84 Mt/year) from 2024 to 2027 and -4.4% (i.e. -86 Mt/year) from 2028 to 2030. Additionally, two “rebasing” (punctual adjustments) are also scheduled in 2024 (-90 Mt) and 2026 (-27 Mt). The cap in 2030 will thus be 774 Mt.
The Market Stability Reserve (MSR)
The Market Stability Reserve is a market mechanism whose aim is to provide stability to the EU ETS market. The reserve was decided at the end of 2015 and implemented in 2019 to address the large excess of emission allowances that has been accumulated in the system since its creation, driving down the price of carbon and thus being a weaker incentive to reduce emissions. The general function of the MSR is to help to ensure a satisfactory adequation between the supply and the demand of quotas.
This mechanism is used each year to calculate the number of allowances present in the system. If this number exceeds a ceiling value, the auction volume for the following year is adjusted downwards. Conversely, if it is below a floor value, some permits are reinjected from the reserve. In practice, the upper limit is set at 833 MtCO2, and 24% of the previous year's surplus (12% after 2030) is absorbed by the MSR. From 2024 onwards, a “buffer” means that if the previous year’s surplus is lower than 1096 Mt and higher than 833 Mt, the difference between the surplus and 833 Mt will be absorbed (instead of 24 %). The lower limit is set at 400 MtCO2, and the MSR releases 100 MtCO2 of allowances, within the limit of what is available in the reserve. Between those two values, there is no action of the MSR.
In addition, a total of 900 million allowances have been back loaded in 2014-2016 into the MSR. In other words, the auction volume reduced by 400 million allowances in 2014, 300 million in 2015 and 200 million in 2016 has been transferred into the reserve rather than auctioned in 2019-2020.
Banking and hedging behaviours
Additional strategic aspects are considered in the EU ETS design. First, the possibility for some actors of banking allowances: in a cap-and-trade system, actors have the ability to bank permits for future use, before the end of the compliance period. Banking constitutes an additional demand for CO2 allowances beyond firms’ need to cover the emissions by the end of the current year. Firms have an incentive to bank, in other words, to hold CO2 allowances from one year to the other if they expect future carbon prices to increase. Therefore, banking allows that expectations on future market scarcity are priced into carbon prices.
Further, some actors may also show hedging behaviours. In the EU ETS, power generators hold CO2 allowances to hedge for future power sales. They buy CO2 quotas beyond their need to cover their annual emissions and use these allowances to hedge the carbon prices for power they sell several years forward, while expecting higher constraint in the future. CO2 hedging demand has gradually increased since 2008 because power firms in Western Europe no longer receive free CO2 allowances as of 2013.
The Innovation Fund
The Innovation Fund focuses on highly innovative technologies and flagship projects within Europe that can bring significant greenhouse gas emission reductions.
The EU ETS provides the revenues for the Innovation Fund from the monetisation of 530 million allowances. In practice, the Innovation Fund allowances from the EU ETS are being auctioned based on the agreed schedule and the revenues perceived are later used to provide support to innovative projects.
METHODOLOGY
The approach used in this Executive Brief builds upon the POLES-Enerdata model, a partial equilibrium model of the global energy system. It covers the entire energy sector, from production to trade, transformation, and final use for a wide range of fuels and sectors. The model’s scope is global, with an explicit representation of 66 geographical entities. POLES-Enerdata runs in annual time steps, with the model’s outlooks typically extending from 2000 to 2050.
In POLES-Enerdata, a carbon value is set to encourage actors to cut their emissions through such additional, environmental costs making carbon-emitting fuels and technologies less competitive.
The EU ETS and the related MSR, as described above, are modelled using this proxy parameter. It allows to quantify through a carbon price the additional effort, compared to a baseline scenario, to reach the emissions cap objective at the EU ETS perimeter.
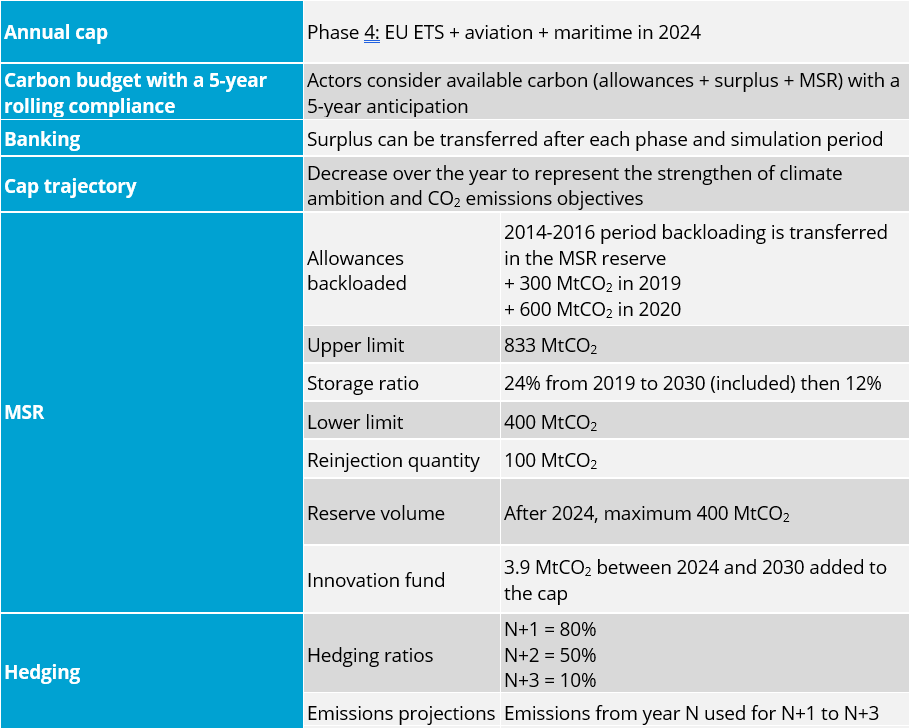
The MSR is represented with a rolling budget approach. Hence, a kind of actors' myopia is considered, with a rolling compliance only over 5 years that corresponds to what is currently found in the literature, and not over the whole period until 2050. In other words, the cumulative EU ETS emissions from year N to N+5 cannot be higher than the carbon budget seen in year N.
Table 1 gathers all the elements considered in the current POLES-Enerdata modelling set-up.
Table 1: MSR design considered
CASE STUDY AND RESULTS
Scenario assumptions and set-up
In this Executive Brief, EnerBlue1 is considered as the reference scenario. It is worth noticing that this scenario is defined by the achievement of new NDCs submitted up to end of 2022, which leads to a global temperature increase of around 2.5°C. Hence, this scenario already embeds a certain level of climate ambition, in particular at the EU level.
On top of the parameters already set in part 2, an ambitious emissions cap is considered, reaching 0 in 2050 (see figure 1). This assumption is however not as ambitious as a cap decreasing linearly to 0 after 2030, which would lead to net-zero emissions in the EU ETS around 2040, as envisaged in some scenarios.
Figure 1: Assumption for the EU ETS cap
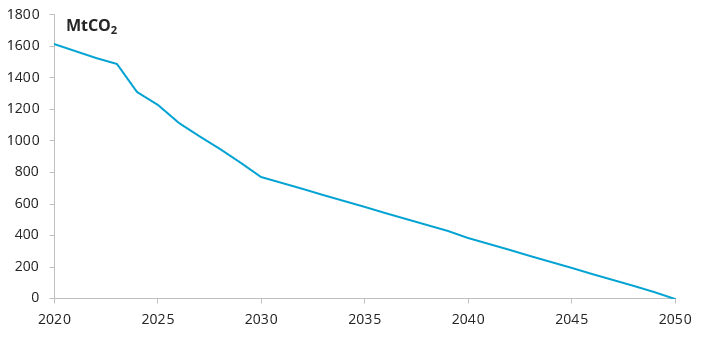
Source: Enerdata, POLES model
Scenario results
Under the scenario configuration described above and using the POLES-Enerdata methodology discussed in section 2, a carbon price trajectory is calculated as a model result, which is commented in the following.
Price stabilisation by 2030
In the 2020s, the carbon price in the EU ETS remains relatively stable at around €70-75/tCO2. This trajectory is coherent with the most recent literature on the topic, although in the lower range of the available benchmarks.
The stable trajectory for the allowance price in our scenario is explained to a certain extent by the existence of other policies fostering EU decarbonisation by 2030. The “Fit for 55” renewable and energy efficiency targets are indeed achieved in 2030, with 42% renewables in the final consumption (2 points higher than the objective), and a total final consumption of around 790 Mtoe. The EU ETS acts as one of multiple policy instruments, and the mitigation effort is therefore shared across different levers – the EU ETS price being one of them for the power sector and industry. Countries are indeed enforcing regulatory measures, as well as incentives for clean technologies (e.g. feed-in tariffs or premiums for renewable energy sources). Hence, the CO2 price is not the only decarbonisation signal, and therefore does not necessarily need to increase by 2030 to ensure emission reductions in line with the cap.
The allowance price is however not declining below €70/tCO2, due to two main reasons. First, a certain price level is required on the EU ETS to achieve sufficient emission reductions: the other measures in place are of course not enough alone. Second, the MSR mechanism helps to maintain the price until 2025. The action of the MSR on the market and the volumes in the reserve are shown on figure 3.
Figure 2: The EU ETS carbon price evolution until 2030
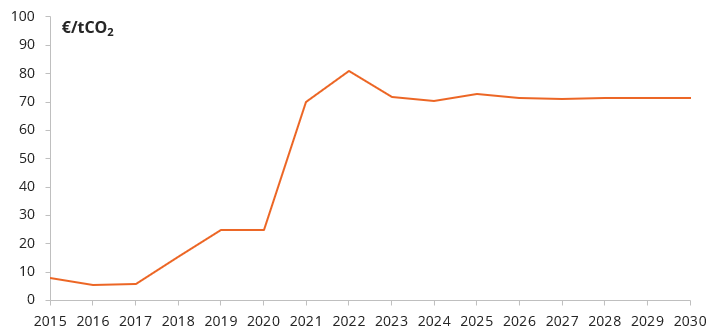
Source: Enerdata, POLES model
The MSR was filled until 2021 by the allowances backloaded from the 2010s as a surplus period for allowances. Subsequently, the reserve is expected to keep absorbing permits to maintain the EU ETS in a relatively stable price environment until 2025. This prevents an excessive supply of permits leading the price to drop, and therefore investments in clean technologies to decrease, with the associated lock-in effects and inertia. The MSR therefore correctly plays its role as a stabilising mechanism on the EU ETS.
Figure 3: The MSR reserve until 2030
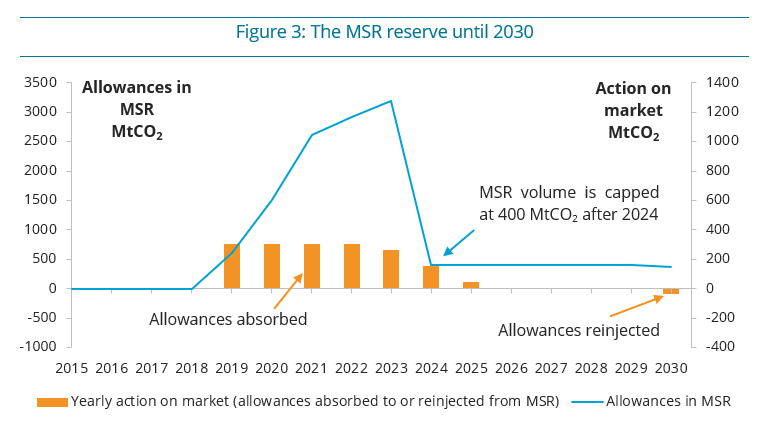
Source: Enerdata, POLES model
After 2025, the adequation between supply and demand of allowances leads to a stable price signal without contribution of the MSR until 2029. In 2030, the MSR starts to reinject allowances for the first time, as the market gets shorter, as is further developed in the next section.
Significant price increase after 2030
After 2030, the EU ETS price starts to progressively increase, reaching around €130/tCO2 in 2040. After that, it quickly skyrockets and exceeds €500/tCO2 in 2044.
Figure 4 presents the evolution of the EU ETS price after 2030.
Figure 4: The EU ETS carbon price evolution after 2030
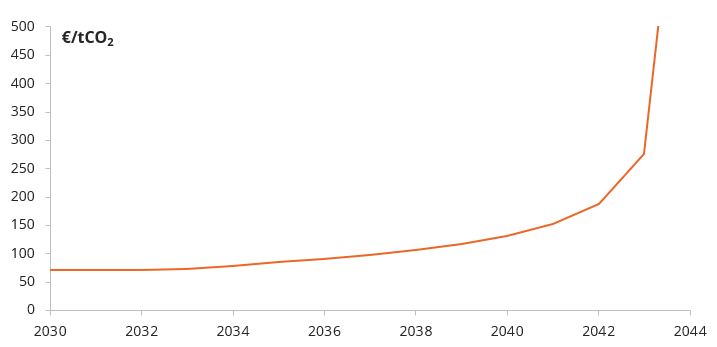
Source: Enerdata, POLES model
With the cap continuing to progressively decrease to low levels after 2030, significant decarbonisation efforts are required from power generators and industry players. With the low-hanging fruits being already implemented in the previous decade, the required abatement efforts are stronger, just as the importance of abatement costs from industry over those of the power sector. As shown on Figure 5, the MSR reinjects all of its 400 MtCO2 stock in the market between 2030 and 2034, after which it cannot help to maintain the price any more.
After 2040, the cap is getting closer to 0 and the market is getting particularly tense. The imperfect anticipation of actors has led them not to foresee the high decarbonisation challenge for this decade. If the current EU ETS market design is not updated by then, with no possible action by the MSR (empty reserve), the price is surging to over €500/tCO2 in 2044. This illustrates the inertia of energy systems, and the anticipation required to achieve a deep decarbonisation in the considered sectors. Our results therefore show that the current system will reach its limits in the 2040 decade, and that a revision of its design should be planned – which is expected from the European Commission in the upcoming years.
Figure 5: The MSR reserve after 2030
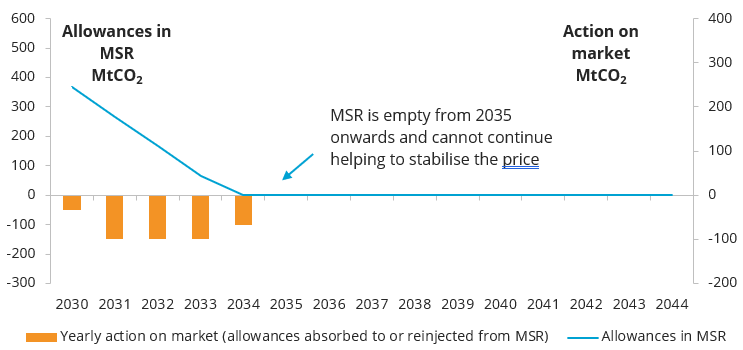
Source: Enerdata, POLES model
Finally, a small note to keep in mind when looking at CO2 price projections: even if a robust and reliable methodology was used to model the EU ETS in our energy-climate scenario, the carbon prices provided in this Brief should be considered while keeping in mind the high level of uncertainties surrounding the EU ETS, all the more over the long-term time horizon observed here. That being said, the current exercise allows us to confidently identify how the system would behave and provide with good orders of magnitude for the carbon price.
CONCLUSION
Our results show that the EU ETS price could remain relatively stable around €70/tCO2 by 2030, due to the existing overlap with other, complementary policy instruments and thanks to the absorption of excess allowances by the MSR. Our scenarios features the achievement of renewables and efficiency targets for 2030, assuming that Member States are drivers of the ambition by themselves, not over-relying on the ETS.
The price is then expected to progressively increase to around €130/tCO2 by 2040, with the market getting more constrained, and the MSR helping to smooth the rise by reinjecting allowances onto the market.
However, with the current design of the market and the MSR, the EU ETS price would skyrocket in the early to mid-2040s, if it were the only tool used to guarantee the equilibrium between offer and demand of allowances, in a context of high climate objectives and hence a constrained emissions cap trajectory. This surge could in fact happen even sooner, if the European Commission was to set a more stringent cap for allowances allocation than the one considered in this study, which is probable.
These results raise some concerns about the future of the EU ETS and highlight the need for updating its design so as to be compatible with a very low GHG emissions environment in the 2040-2050 decade. Among dimensioning factors, the possible inclusion of negative emission technologies in the EU ETS – which is not the case as of today – is surely one of the most impactful ones. Looking even beyond, the future role of the market, once CO2 emissions are very close to zero, must also be anticipated. Will the market continue to exist, to ensure that emissions remain net-zero, or will it be replaced by another instrument?
KEY TAKEAWAYS
- The EU ETS price is expected to remain stable at around €70-75/tCO2 by 2030, with mitigation efforts triggered also by other measures.
- The price is then likely to increase in the 2030s, up to around €130/tCO2 by 2040, driven by an increasing decarbonisation context.
- The MSR plays its role in maintaining a stable price signal up to 2035.
- The CO2 price could then skyrocket in the 2040s according to our results, showing the need for a revision of the system design on the longer term.
Notes
1- See EnerFuture service
ABOUT THE AUTHORS


