United Arab Emirates Key Figures
- Population:
- 10.9 million
- GDP growth rate:
- 3.76 %/year
- Energy independence:
- 100%
Data of the last year available: 2024
- Total consumption/GDP:*
- 85.9 (2015=100)
- CO2 Emissions:
- 16.6 tCO2/cap
- Rate of T&D power losses:
- 5.18%
* at purchasing power parity
View all macro and energy indicators in the United Arab Emirates energy report
United Arab Emirates Energy News
View all news, archive your new and create your own daily newsletters only on your topics/countries of interest with Key Energy Intelligence
United Arab Emirates Energy Research
- United Arab Emirates's Energy & Climate Policy Framework: The UAE aims for 32% clean energy (nuclear & renewables) in its 2030 power mix, targeting net-zero emissions by 2050. Dubai seeks 75% clean energy by 2050, while Abu Dhabi and other emirates implement distinct energy strategies. The country is advancing nuclear, renewables, and green hydrogen, with robust energy efficiency and climate mitigation plans.
- United Arab Emirates's Energy Companies: TAQA supplies 71% of Abu Dhabi's power, while ADNOC leads oil and gas production. Key players include Masdar for renewables, Barakah for nuclear, and various IPPs. DEWA manages Dubai's electricity, and ADNOC oversees upstream oil, with five refineries nationwide. Gas production is led by ADNOC Offshore and Sour Gas.
- United Arab Emirates's Energy Supply & Demand: The UAE's energy mix has shifted, with gas's share in power generation declining to 71% in 2024, benefiting nuclear (20%) and solar (8%). Total energy consumption reached 92 Mtoe, heavily reliant on gas (66%). Installed electricity capacity is dominated by gas (75%), followed by nuclear (13%) and solar (7%). Power generation grew by 7% annually since 2020, reaching 178 TWh. Oil production decreased slightly to 181 Mt, while gas production increased to 62 bcm. GHG emissions rose to 241 MtCO2eq in 2023.
- United Arab Emirates's Energy Use & Price by Sector: Since 2022, final energy consumption has surged by 7% annually, with gas dominating at 49%. Industry leads demand (55%), followed by transport (19%) and residential/tertiary sectors (17%). Electricity prices have remained stable across sectors.
- United Arab Emirates's Issues & Prospects: The UAE is heavily investing in renewable energy, particularly solar, with 10 GW planned, alongside hydrogen and biomass projects. Significant investments are also being made in electricity infrastructure, including hydropower and transmission networks. Additionally, the country is expanding its oil and gas production capacities, while exploring green hydrogen production from nuclear energy.
Benefit from up to 2 000 up-to-date data series for 186 countries in Global Energy & CO2 data
A data overview is available in the global energy statistics app
United Arab Emirates Total Energy Production & Consumption
Total energy consumption has increased by 3%/year on average since 2017, reaching 92 Mtoe in 2024. It almost doubled between 2000 and 2016 and decreased sharply in 2017 (-14%) due to data revisions.
Total energy consumption is heavily based on gas (66%), despite a decrease in its share(-5 points since 2019); it is followed by oil with 21% (2024), nuclear and solar (12%), and coal (1%).
Total energy consumption per capita is very high, with around 8.5 toe in 2024 (the 8th highest worldwide.
Graph: Primary Consumption Trends by Energy Source
Source: United Arab Emirates energy report
Interactive Chart United Arab Emirates Total Energy Production & Consumption
Source: Global Energy & CO2 data
Benefit from up to 2 000 up-to-date data series for 186 countries in Global Energy & CO2 data
View the detailed fondamentals of the market at country level (graphs, tables, analysis) in the United Arab Emirates energy report
United Arab Emirates Oil Production & Consumption
Crude oil production decreased by 1% in 2024 to 181 Mt, after a strong increase in 2021 (+12%) and a 7% reduction in 2020. It had previously remained stable between 2015-2019 at around 186 Mt, after a rapid increase of around 5.4%/year between 2010 and 2015. In 2024, oil production was 27% higher than in 2010, but almost at the same level as in 2019.
The country exports around 72% of its production (2024), almost exclusively to Asia and the Pacific region.
Source: United Arab Emirates energy report
Interactive Chart United Arab Emirates Crude Oil Production & Consumption
Source: Global Energy & CO2 data
Interactive Chart United Arab Emirates Refined Oil Products Production & Consumption
Source: Global Energy & CO2 data
Benefit from up to 2 000 up-to-date data series for 186 countries in Global Energy & CO2 data
Additionally, for more detailed information on refineries, you can request a sample of our EMEA Refineries Dataset
United Arab Emirates Natural Gas Production & Consumption
Gas production has increased by 5%/year since 2021, reaching 62 bcm in 2024. It peakedin 2015 and 2016 (~+11% to 62 bcm) and got back to its previous levels in 2017. ADNOC started production at the Shah gas project in Abu Dhabi in 2015 to process about 1 bcf/d (or 10.3 bcm/year) of sour gas to produce about 500 mcm/d (5.15 bcm/year) of usable natural gas. This project is crucial to limiting the soaring gas imports.
Source: United Arab Emirates energy report
Interactive Chart United Arab Emirates Gas Production & Consumption
Source: Global Energy & CO2 data
Benefit from up to 2 000 up-to-date data series for 186 countries in Global Energy & CO2 data
Additionally, for more detailed information on the LNG trade, you can request a sample of our EMEA LNG Trade Dataset
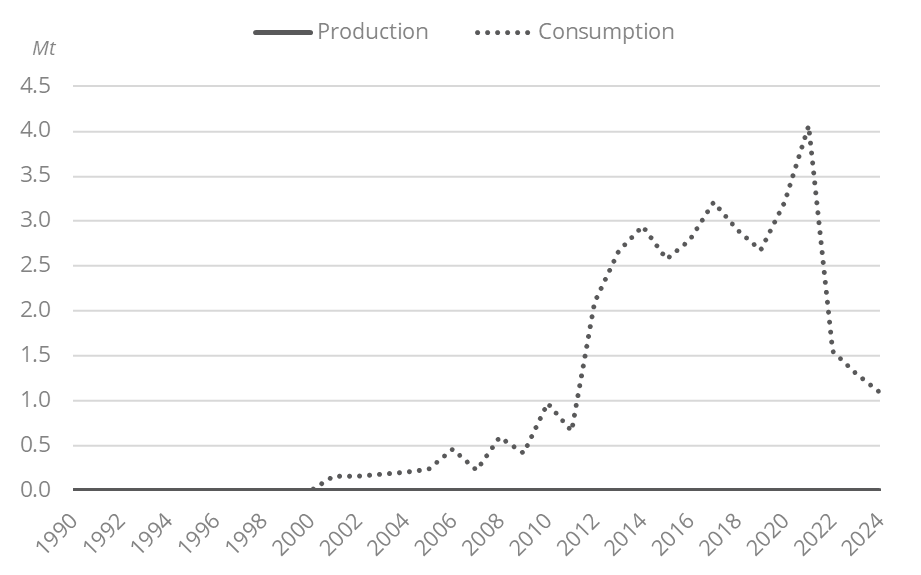
United Arab Emirates Coal and Lignite Production & Consumption
The UAE imports coal for its non-metallic mineral industry (1.1 Mt in 2024).
Graph: Coal Production & Consumption
Source: United Arab Emirates energy report
Interactive Chart United Arab Emirates Coal and Lignite Production & Consumption
Source: Global Energy & CO2 data
Benefit from up to 2 000 up-to-date data series for 186 countries in Global Energy & CO2 data
View the detailed consumption trends at country level (graphs, tables, analysis) in the United Arab Emirates energy report
United Arab Emirates Renewable in % Electricity Production
The UAE targets 32% of clean sources in the power mix in 2030 (renewables and nuclear). The updated Energy Strategy 2050 (2023) aims to supply 44% of its energy consumption with renewables by 2050 and to triple the capacity of renewables.
Dubai aims to cover 25% of its energy consumption from solar in 2030 and to reach 75% of clean energy sources (including nuclear) by 2050.
Source: United Arab Emirates energy report
Interactive Chart United Arab Emirates Share of Renewables in Electricity Production (incl hydro)
Source: Global Energy & CO2 data
Benefit from up to 2 000 up-to-date data series for 186 countries in Global Energy & CO2 data
United Arab Emirates GHG emissions and CO2 emissions
The third update of the country's NDC (2023) raised the GHG reduction target to 40% by 2030 compared to a BAU scenario (31% previously).
Through its Net Zero 2050 Strategic Initiative launched in 2020, the UAE aims to achieve carbon neutrality by 2050. In 2021, the Ministry of Energy and Infrastructure renewed the national target of 70% CO2 emissions cut by 2050 (initially formulated in the UAE Vision 2050).
Source: United Arab Emirates energy report
Interactive Chart United Arab Emirates CO2 emissions
Source: Global Energy & CO2 data
Benefit from up to 2 000 up-to-date data series for 186 countries in Global Energy & CO2 data
View the detailed consumption trends at country level (graphs, tables, analysis) in the United Arab Emirates energy report