
- Update
- Format
- 3 files (PDF report, 2 Excel files)
- Pages
-
53 (Report only)
- Delivery
- Immediate by e-mail
- GENERAL OVERVIEW
- ENERGY AND CLIMATE POLICY FRAMEWORK
- ENERGY COMPANIES
- ENERGY SUPPLY AND DEMAND
- ENERGY USE AND PRICE BY SECTOR
- ISSUES AND PROSPECTS
- STATISTICS
- ABBREVIATIONS
- GLOSSARY
Buy United Arab Emirates energy report
Price without VAT. Depending on your status and location, VAT might be applicable. Get in touch with us for more information.
After validation, you will immediately receive 3 files by email (one pdf report and 2 excel files containing the datasets).
Overview
The UAE is advancing its Energy & Climate Policy Framework, targeting net-zero emissions by 2050 through expanded nuclear and renewable energy, including ambitious solar and hydrogen initiatives. Governed by federal and emirate-level bodies, the strategy prioritises efficiency, sustainability, and diversified energy sources while reducing reliance on gas.
Get more details on the table of contents and data files, as well as the list of graphs and tables by browsing the tabs below.
Highlights
- For 2030, the Government targets a 32% share of nuclear and renewables in the power mix and a 40% reduction in GHG emissions compared to a BAU scenario.
- TAQA supplies around 70% of the power generated in Abu Dhabi.
- ADNOC is the main oil and gas producer.
- The share of gas in the power mix has dropped by 28 points since 2019, reaching 71% in 2024, to the benefit of nuclear (20%) and solar (8%).
- Final energy consumption has been growing rapidly since 2022. Gas covers 49% of this consumption.
- The UAE is investing massively in solar energy, with 10 GW planned. Abu Dhabi is studying the possibility of producing hydrogen from nuclear.
Energy & Climate Policy Framework
The United Arab Emirates (UAE) is a federal state made up of seven emirates: Abu Dhabi, Dubai, Sharjah, Ajman, Umm Al Quwain, Ras Al Khaimah and Fujairah. The UAE is bordered by Oman to the east and Saudi Arabia to the south; it shares sea borders with Qatar, Iran, and Pakistan.
Energy Companies
Oil:
Abu Dhabi
Energy Supply & Demand
Oil:
Crude oil production decreased by 1% in 2024 to 181 Mt, after a strong increase in 2021 (+12%) and a 7% reduction in 2020. It had previously remained stable between 2015-2019 at around 186 Mt, after a rapid increase of around 5.4%/year between 2010 and 2015. In 2024, oil production was 27% higher than in 2010, but almost at the same level as in 2019.
Energy Use and Price by Sector
Energy Prices in Transport:
The prices of gasoline and diesel were deregulated in 2015. The new pricing formula is based on average global prices plus operating costs. Motor fuel prices rose by around 70% from 2020 to 2022 for gasoline and diesel, reaching a peak at US$0.89/l for gasoline and US$0.99/l for diesel in 2022, before decreasing by 21% and 13%, respectively, to US$0.77/l and US$0.78/l in 2024.
Issues & Prospects
Electricity:
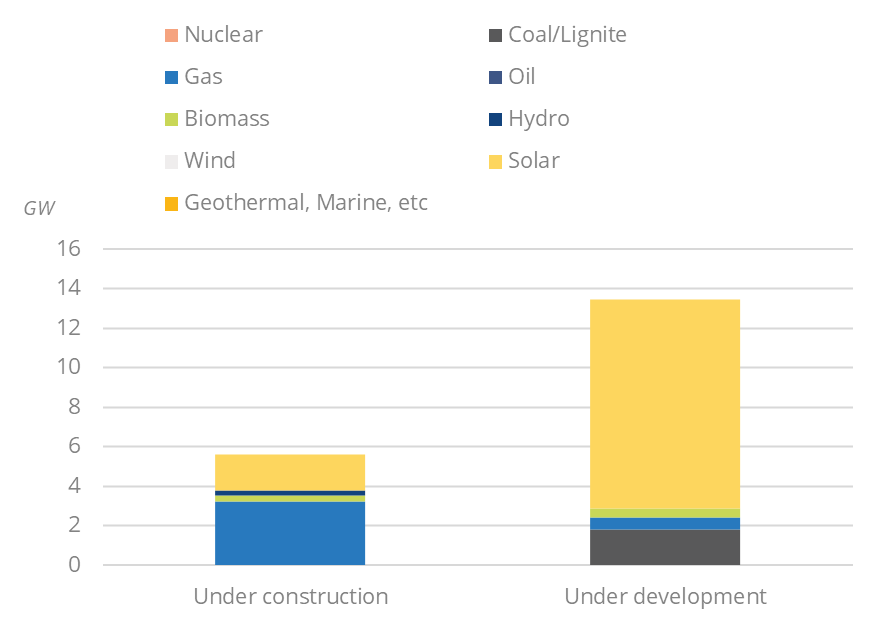
The sharp growth in the consumption of electricity has led the UAE to commit to making important investments for the construction and extension of power plants.
Graph: Upcoming New Capacity by Energy Source
- Graph 1: Primary Consumption Trends by Energy Source
- Graph 2: Total Consumption Market Share by Energy (2024)
- Graph 3: Installed Electric Capacity by Source
- Graph 4: Installed Electric Capacity by Source (2024)
- Graph 5: Gross Power Production by Source & Consumption
- Graph 6: Power Generation by Source (2024)
- Graph 7: Crude Oil Production & Consumption
- Graph 8: Petroleum Products Production & Consumption
- Graph 9: Gas Production & Consumption
- Graph 10: Coal Production & Consumption
- Graph 11: GHG Emissions and CO2-energy Emissions
- Graph 12: Final Demand Trends by Energy Source
- Graph 13: Final Consumption by Sector
- Graph 14: Final Consumption Market Share by Sector (2024)
- Graph 15: Final Consumption in Industry by Energy Source
- Graph 16: Energy Prices in Industry (Taxes Included)
- Graph 17: Final Consumption in Transport by Energy Source
- Graph 18: Energy Prices in Transport (Taxes Included)
- Graph 19: Final Consumption in Residential, Services, Agriculture by Energy Source
- Graph 20: Energy Prices in Residential (Taxes Included)
- Graph 21: Upcoming New Capacity by Energy Source
- Economic Indicators: Annual historical data including population, GDP growth, imports and exports, inflation rate, energy security and efficiency indicators, CO2 emissions.
- Supply Indicators: Historical data including oil and gas reserves, electric and refining capacity, energy production, power production and external trade. All are detailed by energy source.
- Demand Indicators: Historical data including consumption per inhabitant, consumption trends, total consumption by energy source, final consumption by energy source and sector, and electricity consumption by sector.
- Energy Balances: Single table displaying the overall energy industry balance per annum, also graphically displayed by energy sub-segment.
The United Arab Emirates energy market data since 1990 and up to
is included in the Excel file accompanying the United Arab Emirates country report.
It showcases the historical evolution, allowing users to easily work with the data.
Key Data included in the excelsheet:
- Economic indicators: Annual historical economic indicators, energy security, energy efficiency and CO2 emissions.
- Supply indicators: Annual historical reserves, capacity, production and external trade (imports(+) exports(-) balance).
- Demand indicators: Annual historical consumption per capita, consumption trends, total consumption, final consumption (per energy and per sector) and electricity consumption total and per sector.
- Energy Balance: total and per energy.
- United Arab Emirates Energy Prices: In addition to the analysis provided on the report we also provided a data set which includes historical details on the United Arab Emirates energy prices for the follow items: price of premium gasoline (taxes incl.), price of diesel (taxes incl.), price of electricity in industry (taxes incl.), price of electricity for households (taxes incl.), price of natural gas in industry (taxes incl.), prices of natural gas for households (taxes incl.), spot price of Brent and CO2 emissions (from fuel combustion).