Senegal Key Figures
- Population:
- 18.5 million
- GDP growth rate:
- 6.89 %/year
- Energy independence:
- 68.5%
Data of the last year available: 2024
- Total consumption/GDP:*
- 95.6 (2015=100)
- CO2 Emissions:
- 0.79 tCO2/cap
- Rate of T&D power losses:
- 12.3%
* at purchasing power parity
View all macro and energy indicators in the Senegal energy report
Senegal Energy News
View all news, archive your new and create your own daily newsletters only on your topics/countries of interest with Key Energy Intelligence
Senegal Energy Research
- Senegal's Energy & Climate Policy Framework: Senegal aims for 40% renewable energy in power capacity by 2030, with policies overseen by multiple ministries and regulatory bodies. The country has launched initiatives like the National Pact for Energy and the Just Energy Transition Partnership (JETP) to expand renewable capacity, accelerate electrification, and promote clean cooking. The Electricity Code (2021) and other regulations support these goals, with a focus on universal energy access and a low-carbon energy system.
- Senegal's Energy Companies: Senegal's energy sector comprises state-owned Senelec and independent power producers, including Karpowership. Senelec, with a 529 MW capacity, generated 26% of electricity in 2023. Key players like Malicounda Power and West Africa Energy contribute significantly. Transmission and distribution remain under Senelec's monopoly. In oil, Petrosen oversees upstream and downstream activities, with TotalEnergies leading distribution. Gas projects, including GTA, are under development, with LNG exports commencing in 2025.
- Senegal's Energy Supply & Demand: Senegal's energy supply is dominated by oil (58%), with rapid consumption growth (+5%/year). It began oil and gas production in 2024-25, with LNG exports starting in 2025. Electricity capacity is 1.8 GW, with oil (44%) and gas (25%) leading generation. The country faces high transmission losses and imports electricity. It has significant gas reserves and solar potential.
- Senegal's Energy Use & Price by Sector: Senegal's energy demand is rising rapidly, with transport consuming nearly half. Electricity prices remain high, driven by oil imports.
- Senegal's Issues & Prospects: Senegal plans to expand its gas transmission network, converting thermal power plants to gas and adding 10 GW of capacity by 2050, split equally between gas and renewables. Key projects include a 255 MW CCGT plant, the Samba Galou dam, and a 300 MW solar expansion. The Yakaar-Teranga gas field, with reserves of 708 bcm, aims to start production in 2026, supporting domestic energy needs.
Benefit from up to 2 000 up-to-date data series for 186 countries in Global Energy & CO2 data
A data overview is available in the global energy statistics app
Senegal Total Energy Production & Consumption
Total energy consumption is growing rapidly (+5%/year on average since 2013, including+2% in 2024) and reached 6.7 Mtoe in 2024. Per capita energy consumption reached 0.4 toe in 2024, which is about a fifth below the average for Sub-Saharan Africa.
In 2024, oil covered 58% of the country's energy needs (+20 pp since 2010), biomass (mainly wood) 32% (-23 pp), and coal 8% (+3 pp). The share of oil is much higher than the Sub-Saharan Africa average (21%), while the share of biomass is much lower (51% for the regional average).
Source: Senegal energy report
Interactive Chart Senegal Total Energy Production & Consumption
Source: Global Energy & CO2 data
Benefit from up to 2 000 up-to-date data series for 186 countries in Global Energy & CO2 data
View the detailed fondamentals of the market at country level (graphs, tables, analysis) in the Senegal energy report
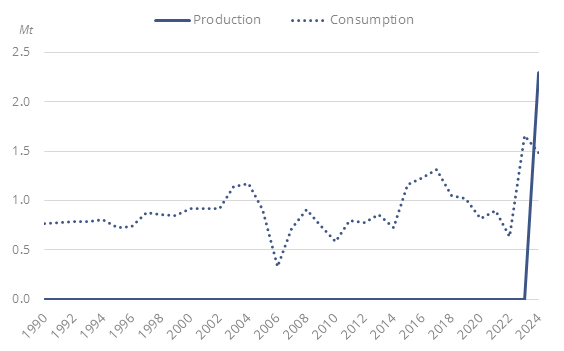
Senegal Oil Production & Consumption
The country started producing crude oil in 2024 (2.3 Mt in 2024); production is expected to exceed 4 Mt in 2025 (100 kb/d). In 2024, Senegal imported 1.5 Mt of crude oil from Nigeria.
Graph: Crude Oil Production & Consumption
Source: Senegal energy report
Interactive Chart Senegal Crude Oil Production & Consumption
Source: Global Energy & CO2 data
Interactive Chart Senegal Refined Oil Products Production & Consumption
Source: Global Energy & CO2 data
Benefit from up to 2 000 up-to-date data series for 186 countries in Global Energy & CO2 data
Additionally, for more detailed information on refineries, you can request a sample of our EMEA Refineries Dataset
Senegal Natural Gas Production & Consumption
Large gas resources were discovered in the Grand Tortue Ahmeyim (GTA) gas field in 2014 between Senegal and Mauritania, that are estimated to hold around 425 bcm of gas (15 Tcf). The governments of Senegal and Mauritania signed an agreement in 2018 to equally split resources, taxes, and revenues.
Source: Senegal energy report
Interactive Chart Senegal Gas Production & Consumption
Source: Global Energy & CO2 data
Benefit from up to 2 000 up-to-date data series for 186 countries in Global Energy & CO2 data
Additionally, for more detailed information on the LNG trade, you can request a sample of our EMEA LNG Trade Dataset
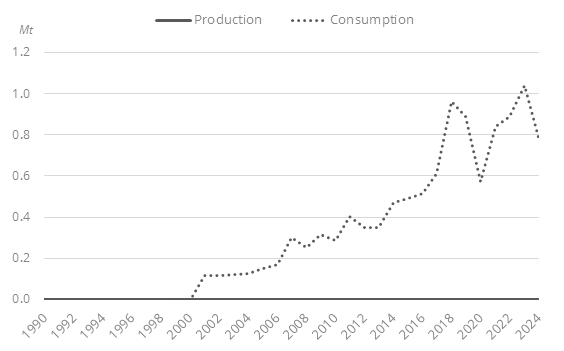
Senegal Coal and Lignite Production & Consumption
The country imported 0.8 Mt of coal in 2024. Coal is mostly consumed in industry (63%); the rest is used for power generation.
Graph: Coal Production & Consumption
Source: Senegal energy report
Interactive Chart Senegal Coal and Lignite Production & Consumption
Source: Global Energy & CO2 data
Benefit from up to 2 000 up-to-date data series for 186 countries in Global Energy & CO2 data
View the detailed consumption trends at country level (graphs, tables, analysis) in the Senegal energy report
Senegal Renewable in % Electricity Production
ANER, the National Agency for Renewable Energy, was created in 2013 to promote renewables.
Senegal's National Renewable Energy Action Plan (PANER, 2015) aims to raise the share of renewables (including hydropower) in the grid-connected capacity to 32% in 2030 (over 630 MW). JETP, the Just Energy Transition Partnership (2023), raised this target to 40% by 2030. In 2024, renewable capacities accounted for 24% of the total capacity.
Source: Senegal energy report
Interactive Chart Senegal Share of Renewables in Electricity Production (incl hydro)
Source: Global Energy & CO2 data
Benefit from up to 2 000 up-to-date data series for 186 countries in Global Energy & CO2 data
Senegal GHG emissions and CO2 emissions
In its NDC (2020), the country committed to reduce GHG emissions by 7% by 2030 compared to BAU levels (unconditional target) and by 29.5% with international support (conditional target).
Source: Senegal energy report
Interactive Chart Senegal CO2 emissions
Source: Global Energy & CO2 data
Benefit from up to 2 000 up-to-date data series for 186 countries in Global Energy & CO2 data
View the detailed consumption trends at country level (graphs, tables, analysis) in the Senegal energy report