
- Update
- Format
- 3 files (PDF report, 2 Excel files)
- Pages
-
53 (Report only)
- Delivery
- Immediate by e-mail
- GENERAL OVERVIEW
- ENERGY AND CLIMATE POLICY FRAMEWORK
- ENERGY COMPANIES
- ENERGY SUPPLY AND DEMAND
- ENERGY USE AND PRICE BY SECTOR
- ISSUES AND PROSPECTS
- STATISTICS
- ABBREVIATIONS
- GLOSSARY
Buy Senegal energy report
Price without VAT. Depending on your status and location, VAT might be applicable. Get in touch with us for more information.
After validation, you will immediately receive 3 files by email (one pdf report and 2 excel files containing the datasets).
Overview
Senegal is advancing its energy transition through ambitious policies, targeting universal electricity access and a significant renewable energy share by the next decade. Key ministries and regulatory bodies oversee energy, environment, and finance, while partnerships like the Just Energy Transition Partnership bolster sustainable development. Progress includes expanding renewables, electrification, and gas infrastructure, alongside reforms in oil, gas, and electricity sectors to enhance efficiency and reduce emissions.
Get more details on the table of contents and data files, as well as the list of graphs and tables by browsing the tabs below.
Highlights
- The country targets universal access to electricity and 40% of renewables in the power capacity by 2030.
- Senelec, the state-owned company, accounts for ¼ of power production, along with several IPPs, the largest of which is Karpowership, which operates a power barge.
- TotalEnergies has the largest service station network.
- Oil accounts for 58% of total energy supply. It also represents 83% of the power mix.
- Senegal started producing oil in 2024 and natural gas in 2025, with LNG exports beginning the same year.
- Final energy consumption is growing quickly, with transport accounting for almost half of the total.
- Electricity prices are among the highest in West Africa.
- The country aims to develop a gas transmission network, mainly to convert all of its thermal power plants to gas.
- Most of the new thermal power plants will be gas fired.
Energy & Climate Policy Framework
The Ministry of Energy, Petroleum and Mining prepares and implements the country's energy policy and supervises the public energy companies.
The Ministry of Environment and Ecological Transition looks after environmental issues. The Ministry of Finance and Budget plays an important part in the financing of investments and energy prices.
Energy Companies
Electricity:
Senelec, the state-owned power utility, has an installed capacity of 529 MW at end-2023 (30% of total capacity), including 444 MW on the interconnected network. The company produced 1.7 TWh in 2023 (stable) or 26% of total generation (35% in 2021). Its concession contract with the State of Senegal, which entered into force in 1999 for a period of 25 years, will expire in 2024.
Energy Supply & Demand
Oil:
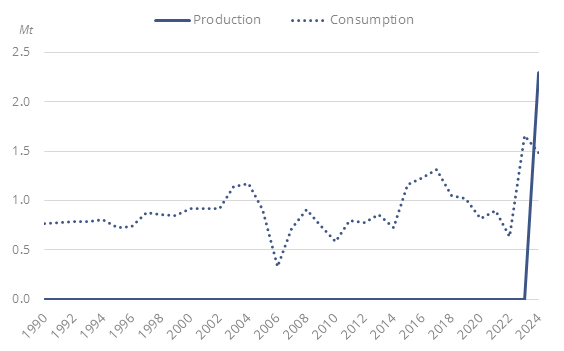
The country started producing crude oil in 2024 (2.3 Mt in 2024); production is expected to exceed 4 Mt in 2025 (100 kb/d). In 2024, Senegal imported 1.5 Mt of crude oil from Nigeria.
Graph: Crude Oil Production & Consumption
Energy Use and Price by Sector
Energy Prices in Residential:
Electricity prices in the residential sector remained stable in 2024 at USDc21.4/kWh, after increasing by 18% in 2023. Previously, in 2022, they declined by 12%.
Similarly to industrial prices, electricity prices for households in Senegal are around 30% higher than in Côte d'Ivoire and around 50% higher than in Ghana.
Issues & Prospects
Gas:
The Yakaar-Teranga natural gas field, located offshore Senegal, is developed by Kosmos Energy (90%). In 2023, BP sold its 60% stake in the project to Kosmos Energy, following a disagreement with the government on the use of this gas (export for BP vs domestic market for the government). The government aims to expedite the field's development to start production in 2026.
- Graph 1: Primary Consumption Trends by Energy Source
- Graph 2: Total Consumption Market Share by Energy (2024)
- Graph 3: Installed Electric Capacity by Source
- Graph 4: Installed Electric Capacity by Source (2024)
- Graph 5: Gross Power Production by Source & Consumption
- Graph 6: Power Generation by Source (2024)
- Graph 7: Crude Oil Production & Consumption
- Graph 8: Petroleum Products Production & Consumption
- Graph 9: Gas Production & Consumption
- Graph 10: Coal Production & Consumption
- Graph 11: GHG Emissions and CO2-energy Emissions
- Graph 12: Final Demand Trends by Energy Source
- Graph 13: Final Consumption by Sector
- Graph 14: Final Consumption Market Share by Sector (2024)
- Graph 15: Final Consumption in Industry by Energy Source
- Graph 16: Energy Prices in Industry (Taxes Included)
- Graph 17: Final Consumption in Transport by Energy Source
- Graph 18: Energy Prices in Transport (Taxes Included)
- Graph 19: Final Consumption in Residential, Services, Agriculture by Energy Source
- Graph 20: Energy Prices in Residential (Taxes Included)
- Graph 21: Upcoming New Capacity by Energy Source
- Economic Indicators: Annual historical data including population, GDP growth, imports and exports, inflation rate, energy security and efficiency indicators, CO2 emissions.
- Supply Indicators: Historical data including oil and gas reserves, electric and refining capacity, energy production, power production and external trade. All are detailed by energy source.
- Demand Indicators: Historical data including consumption per inhabitant, consumption trends, total consumption by energy source, final consumption by energy source and sector, and electricity consumption by sector.
- Energy Balances: Single table displaying the overall energy industry balance per annum, also graphically displayed by energy sub-segment.
The Senegal energy market data since 1990 and up to
is included in the Excel file accompanying the Senegal country report.
It showcases the historical evolution, allowing users to easily work with the data.
Key Data included in the excelsheet:
- Economic indicators: Annual historical economic indicators, energy security, energy efficiency and CO2 emissions.
- Supply indicators: Annual historical reserves, capacity, production and external trade (imports(+) exports(-) balance).
- Demand indicators: Annual historical consumption per capita, consumption trends, total consumption, final consumption (per energy and per sector) and electricity consumption total and per sector.
- Energy Balance: total and per energy.
- Senegal Energy Prices: In addition to the analysis provided on the report we also provided a data set which includes historical details on the Senegal energy prices for the follow items: price of premium gasoline (taxes incl.), price of diesel (taxes incl.), price of electricity in industry (taxes incl.), price of electricity for households (taxes incl.), price of natural gas in industry (taxes incl.), prices of natural gas for households (taxes incl.), spot price of Brent and CO2 emissions (from fuel combustion).