Portugal Key Figures
- Population:
- 10.7 million
- GDP growth rate:
- 1.93 %/year
- Energy independence:
- 36.3%
Data of the last year available: 2024
- Total consumption/GDP:*
- 73.0 (2015=100)
- CO2 Emissions:
- 3.02 tCO2/cap
- Rate of T&D power losses:
- 8.86%
* at purchasing power parity
View all macro and energy indicators in the Portugal energy report
Portugal Energy News
View all news, archive your new and create your own daily newsletters only on your topics/countries of interest with Key Energy Intelligence
Portugal Energy Research
- Portugal's Energy & Climate Policy Framework: Portugal targets 55% GHG reduction and 49% renewables by 2030. The Ministry of Climate and Energy oversees policy, with ERSE regulating electricity and gas. The liberalised energy market dominates, with 95% of electricity and 96% of gas consumption. Renewables aim for 51% of final energy use by 2030, supported by auctions and incentives. Green hydrogen and energy efficiency are key focus areas, with ambitious targets for 2030.
- Portugal's Energy Companies: EDP leads Portugal's electricity market, with significant renewable energy capacity and foreign investment. Galp Energia dominates oil and gas, with upstream projects and a large refining capacity. Chinese firms hold stakes in key energy companies.
- Portugal's Energy Supply & Demand: In 2024, Portugal's energy mix saw renewables reach 87%, with oil remaining dominant. Energy consumption per capita was 35% below the EU average. CO2 emissions fell by 38% since 2005, and 87% of electricity came from renewables.
- Portugal's Energy Use & Price by Sector: Portugal's energy prices are below EU averages, with gas 30% lower and electricity 5% lower. Final energy demand has stabilised at 16 Mtoe, with transport (38%) and buildings (32%) as the largest consumers. Electricity's share in the energy mix must rise to 67% by 2050 to meet climate targets. Industry and transport sectors show varied energy consumption trends, with transport heavily reliant on petroleum. Residential prices increased by 16% in 2024 due to network tariffs.
- Portugal's Issues & Prospects: Portugal aims to expand renewable energy capacity to 23 GW by 2031, with significant investments in solar, wind, and hydrogen projects. Key initiatives include the H2Med hydrogen pipeline and the Tâmega hydroelectric complex. Transmission network upgrades and green hydrogen production are also prioritised.
Benefit from up to 2 000 up-to-date data series for 186 countries in Global Energy & CO2 data
A data overview is available in the global energy statistics app
Portugal Total Energy Production & Consumption
Portugal's primary consumption has been decreasing by 2%/year since 2017, reaching 19 Mtoe in 2024. Consumption per capita is almost 35% lower than the EU average at 1.8 toe.
Oil remained the dominant energy source with a stable share (42% in 2024). The share of renewables has increased by 11 pp since 2010 (22% in 2024), while the share of gas has decreased by 10 pp since 2020 (16% in 2024), and that of coal by 16 pp since 2015 to almost 0%.
Graph: Primary Consumption Trends by Energy Source
Source: Portugal energy report
Interactive Chart Portugal Total Energy Production & Consumption
Source: Global Energy & CO2 data
Benefit from up to 2 000 up-to-date data series for 186 countries in Global Energy & CO2 data
View the detailed fondamentals of the market at country level (graphs, tables, analysis) in the Portugal energy report
Portugal Oil Production & Consumption
Portugal does not produce oil and imported 10.5 Mt of crude oil in 2024 (-3% compared to 2023). In 2024, the main crude oil suppliers were Brazil (43%), Algeria (17%), and the US (10%).
Oil imports by supplier
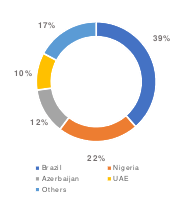
Source: DGEG (2022)
Source: Portugal energy report
Interactive Chart Portugal Crude Oil Production & Consumption
Source: Global Energy & CO2 data
Interactive Chart Portugal Refined Oil Products Production & Consumption
Source: Global Energy & CO2 data
Benefit from up to 2 000 up-to-date data series for 186 countries in Global Energy & CO2 data
Additionally, for more detailed information on refineries, you can request a sample of our EMEA Refineries Dataset
Portugal Natural Gas Production & Consumption
Portugal imports all the gas it consumes. Imports reached 3.6 bcm in 2024 (-17%), mainly as LNG. Imports reached a peak in 2017 at 6.2 bcm. Previously, they remained between 4 and 5 bcm over 2012-16.
Source: Portugal energy report
Interactive Chart Portugal Gas Production & Consumption
Source: Global Energy & CO2 data
Benefit from up to 2 000 up-to-date data series for 186 countries in Global Energy & CO2 data
Additionally, for more detailed information on the LNG trade, you can request a sample of our EMEA LNG Trade Dataset
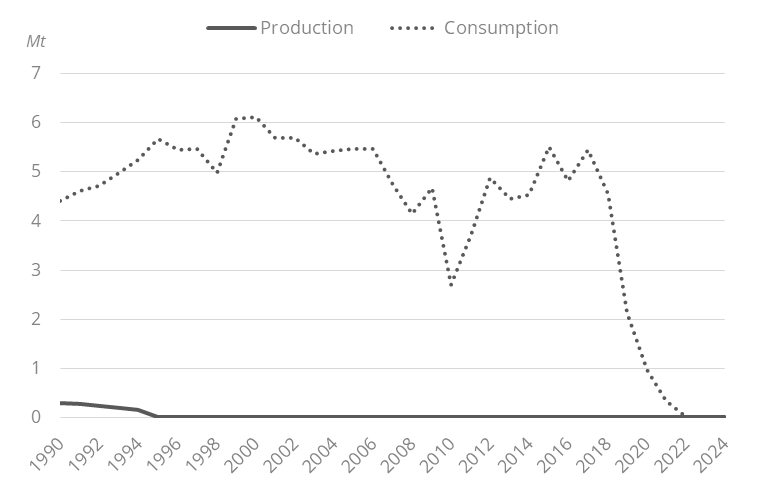
Portugal Coal and Lignite Production & Consumption
The country's low coal production stopped in 1995, and imports have covered consumption until the closure of Portugal's last coal-fired plant in 2021.
Coal consumption stopped in 2022. It had dropped drastically from a level of 5 Mt in 2017. Previously, coal was almost entirely used for power generation.
Graph: Coal Production & Consumption
Source: Portugal energy report
Interactive Chart Portugal Coal and Lignite Production & Consumption
Source: Global Energy & CO2 data
Benefit from up to 2 000 up-to-date data series for 186 countries in Global Energy & CO2 data
View the detailed consumption trends at country level (graphs, tables, analysis) in the Portugal energy report
Portugal Renewable in % Electricity Production
ADENE, a private non-profit association, is Portugal's national agency responsible for the development of renewables and support of decarbonization and energy transition.
According to its updated NECP, Portugal aims to reach a 51% share of renewables in final energy consumption by 2030 and 93% of renewables in power generation by 2026. In 2023, the share of renewables in final energy consumption reached 35.2% (61% for power, 45.6% for heating and cooling, and 8.7% for transport). The target for 2020 was exceeded by 3 points, with an actual share of 34%.
Source: Portugal energy report
Interactive Chart Portugal Share of Renewables in Electricity Production (incl hydro)
Source: Global Energy & CO2 data
Benefit from up to 2 000 up-to-date data series for 186 countries in Global Energy & CO2 data
Learn more about renewables in the European Battery Market Analysis
Portugal GHG emissions and CO2 emissions
The updated NECP aims to reduce GHG emissions (without LULUCF) by 55% in 2030 compared to 2005 levels (from 45-55% in the previous NECP). It also brings forward the carbon neutrality target from 2050 (Roadmap for Carbon Neutrality 2050, RCN 2050) to 2045.
Source: Portugal energy report
Interactive Chart Portugal CO2 emissions
Source: Global Energy & CO2 data
Benefit from up to 2 000 up-to-date data series for 186 countries in Global Energy & CO2 data
View the detailed consumption trends at country level (graphs, tables, analysis) in the Portugal energy report