
- Update
- Format
- 4 files (PDF report, 3 Excel files)
- Pages
-
66 (Report only)
- Delivery
- Immediate by e-mail
- GENERAL OVERVIEW
- ENERGY AND CLIMATE POLICY FRAMEWORK
- ENERGY COMPANIES
- ENERGY SUPPLY AND DEMAND
- ENERGY USE AND PRICE BY SECTOR
- ISSUES AND PROSPECTS
- STATISTICS
- ABBREVIATIONS
- GLOSSARY
Buy Portugal energy report
Price without VAT. Depending on your status and location, VAT might be applicable. Get in touch with us for more information.
After validation, you will immediately receive 4 files by email (one pdf report and 3 excel files containing the datasets).
Overview
Portugal’s energy and climate strategy centres on ambitious decarbonisation, targeting significant emissions reductions and a high renewable energy share by the end of the decade. Governed by the Ministry of Climate and Energy, the policy framework promotes liberalised electricity and gas markets, with robust infrastructure like the Iberian MIBEL market. Renewables, particularly solar and wind, dominate capacity expansion, supported by auctions and green hydrogen initiatives, while energy efficiency programmes drive sectoral transitions.
Get more details on the table of contents and data files, as well as the list of graphs and tables by browsing the tabs below.
Highlights
- The country targets a reduction of 55% in GHG emissions and a 49% share of renewables in final energy consumption in 2030.
- EDP for electricity and Galp Energia for oil and gas dominate their respective markets.
- Chinese companies own 21% of EDP and 25% of REN, the power and gas transmission company.
- The share of renewables in the power mix reached 87% in 2024.
- Gas prices are 30% below the EU average, while electricity prices are only 5% below.
- REN expects to increase its renewable capacity to 23 GW by 2031.
- The 2 Mt/year H2Med (Portugal, Spain, France, and Germany) has obtained authorisation to start the development of the Portugal-Spain interconnection.
Energy & Climate Policy Framework
The Ministry of Climate and Energy oversees the national energy policy and supervises the energy sector through the Secretariat of Energy. The Directorate General for Energy and Geology (DGEG) is responsible for designing, promoting, and evaluating energy policies.
ERSE, Entidade Reguladora dos Serviços Energéticos, is the electricity and gas regulator.
Energy Companies
Electricity:
EDP had an estimated capacity of 8.5 GW in 2024 in Portugal (1/3 of the total), composed mainly of renewables (75%). In the Iberian Peninsula, its capacity reached 13 GW and its power generation 22.4 TWh (-9%). Its worldwide capacity was 29 GW in 2024, of which 25 GW were renewables.
Energy Supply & Demand
Resources:
Portugal does not have hydrocarbon resources. The country has hydroelectric potential of about 32 TWh. Its wind and solar potential is significant.
Energy Use and Price by Sector
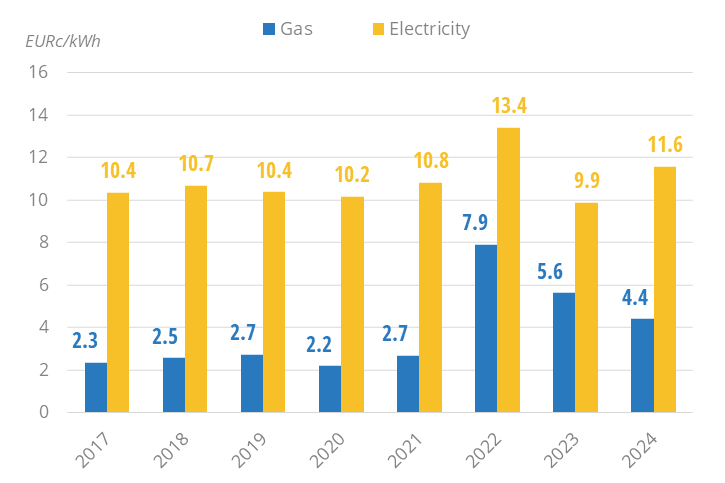
Energy Prices in Industry:
Electricity prices in te industry recorded a 17% increase in 2024; they are almost 30% lower than the EU average (€16.56 c/kWh in 2024). They fell to €11.60 c/kWh, after a 26% decrease in 2023.
Graph: Energy Prices in Industry (Taxes Included)
Issues & Prospects
Electricity:
According to REN's PDIRT 2022-2031, power consumption is expected to increase between 0.7%/year and 1.8%/year on average to reach 57 TWh in 2031. REN foresees that the renewables capacity will increase to 23 GW by 2031 (around 12 GW for solar and 9 GW for wind).
- Graph 1: Final Intensity to GDP
- Graph 2: Primary Consumption Trends by Energy Source
- Graph 3: Total Consumption Market Share by Energy (2024)
- Graph 4: Installed Electric Capacity by Source
- Graph 5: Installed Electric Capacity by Source (2024)
- Graph 6: Gross Power Production by Source & Consumption
- Graph 7: Power Generation by Source (2024)
- Graph 8: CO2 Intensity of Electricity Generation
- Graph 9: Crude Oil Production & Consumption
- Graph 10: Petroleum Products Production & Consumption
- Graph 11: Gas Production & Consumption
- Graph 12: Coal Production & Consumption
- Graph 13: GHG Emissions and CO2-energy Emissions
- Graph 14: CO2-Emissions per Capita
- Graph 15: CO2 Intensity to GDP
- Graph 16: Final Demand Trends by Energy Source
- Graph 17: Final Consumption by Sector
- Graph 18: Final Consumption Market Share by Sector (2024)
- Graph 19: Share of Electricity in Total Final Energy Consumption
- Graph 20: Final Consumption in Industry by Energy Source
- Graph 21: Energy Prices in Industry (Taxes Included)
- Graph 22: Final Consumption in Transport by Energy Source
- Graph 23: Energy Prices in Transport (Taxes Included)
- Graph 24: Final Consumption in Residential, Services, Agriculture by Energy Source
- Graph 25: Energy Prices in Residential (Taxes Included)
- Graph 26: Upcoming New Capacity by Energy Source
- Economic Indicators: Annual historical data including population, GDP growth, imports and exports, inflation rate, energy security and efficiency indicators, CO2 emissions.
- Supply Indicators: Historical data including oil and gas reserves, electric and refining capacity, energy production, power production and external trade. All are detailed by energy source.
- Demand Indicators: Historical data including consumption per inhabitant, consumption trends, total consumption by energy source, final consumption by energy source and sector, and electricity consumption by sector.
- Energy Balances: Single table displaying the overall energy industry balance per annum, also graphically displayed by energy sub-segment.
The Portugal energy market data since 1990 and up to
is included in the Excel file accompanying the Portugal country report.
It showcases the historical evolution, allowing users to easily work with the data.
Key Data included in the excelsheet:
- Economic indicators: Annual historical economic indicators, energy security, energy efficiency and CO2 emissions.
- Supply indicators: Annual historical reserves, capacity, production and external trade (imports(+) exports(-) balance).
- Demand indicators: Annual historical consumption per capita, consumption trends, total consumption, final consumption (per energy and per sector) and electricity consumption total and per sector.
- Energy Balance: total and per energy.
- Portugal Energy Prices: In addition to the analysis provided on the report we also provided a data set which includes historical details on the Portugal energy prices for the follow items: price of premium gasoline (taxes incl.), price of diesel (taxes incl.), price of electricity in industry (taxes incl.), price of electricity for households (taxes incl.), price of natural gas in industry (taxes incl.), prices of natural gas for households (taxes incl.), spot price of Brent and CO2 emissions (from fuel combustion).
The Portugal country dashboards are complemented with country forecasts from EnerFuture (excel file) with scenario comparison.
Data included in the excelsheet:
- Demand: Primary energy consumption, final energy consumption, by fuel, by sector.
- Power: Electricity generation & capacities, by technology.
- CO2: Total CO2 emissions.
- Macro-economy: Main macro-economic assumptions.
- Key indicators: Energy intensity, share of renewables, CO2 emissions per capita and per unit of GDP.