Poland Key Figures
- Population:
- 36.6 million
- GDP growth rate:
- 2.92 %/year
- Energy independence:
- 55.5%
Data of the last year available: 2024
- Total consumption/GDP:*
- 73.0 (2015=100)
- CO2 Emissions:
- 6.96 tCO2/cap
- Rate of T&D power losses:
- 6.26%
* at purchasing power parity
View all macro and energy indicators in the Poland energy report
Poland Energy News
View all news, archive your new and create your own daily newsletters only on your topics/countries of interest with Key Energy Intelligence
Poland Energy Research
- Poland's Energy & Climate Policy Framework: Poland aims to boost renewables to 32.6% of final energy use and 56% of power mix by 2030, cutting GHG emissions by 54% from 1990 levels. The Ministry of Climate and Environment oversees energy and climate policies, while URE regulates the sector. Recent reforms include capacity markets, flexibility services, and support for renewables. The NECP targets 52% renewable electricity by 2030, with EU funding aiding the green transition.
- Poland's Energy Companies: PGE and ENEA lead Poland's power generation, while Orlen Group dominates oil, gas, and retail energy markets. State-owned firms control transmission and distribution networks. Poland is restructuring its coal sector, with PGG and JSW as key players.
- Poland's Energy Supply & Demand: Poland's energy consumption has declined by 4% annually since 2021, with coal's share dropping to 33% in 2024. Renewables and gas are increasingly prominent in the energy mix, while electricity generation has seen a 1.8% rise in 2024. The country remains a net importer of electricity and oil, with significant investments in gas and renewable energy infrastructure.
- Poland's Energy Use & Price by Sector: In 2024, Poland's final energy consumption stabilised at 72 Mtoe after prior declines. Oil remains the primary energy source, with electricity prices 17% higher than the EU average for households and 11% higher for industry. Transport and residential sectors dominate consumption, while industrial demand has decreased. Government measures have mitigated rising energy costs.
- Poland's Issues & Prospects: Poland aims to integrate 9 GW of renewables and 1.4 GW of energy storage by 2035, supported by a EUR 1.2bn EU scheme. The country is modernising its energy sector, reducing coal reliance, and expanding nuclear, gas, wind, and solar projects. Key initiatives include the 3 GW Żarnowiec nuclear plant, offshore wind developments, and grid upgrades to support energy transition.
Benefit from up to 2 000 up-to-date data series for 186 countries in Global Energy & CO2 data
A data overview is available in the global energy statistics app
Poland Total Energy Production & Consumption
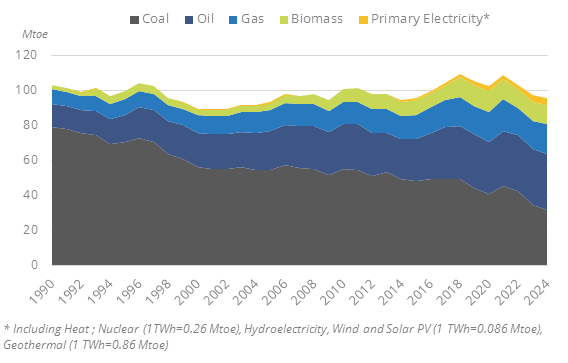
Total primary consumption has decreased by 4%/year since 2021, reaching 95.6 Mtoein 2024. It increased before by 2%/year on average between 2015 and 2019, after a downward trend of -1.5%/year between 2011 and 2015. Total energy consumption per capita was 2.6 toe in 2024 (around 5% below the EU average).
Graph: Primary Consumption Trends by Energy Source
Source: Poland energy report
Interactive Chart Poland Total Energy Production & Consumption
Source: Global Energy & CO2 data
Benefit from up to 2 000 up-to-date data series for 186 countries in Global Energy & CO2 data
View the detailed fondamentals of the market at country level (graphs, tables, analysis) in the Poland energy report
Poland Oil Production & Consumption
Crude oil production is limited and has declined by 6%/year on average since 2018 to 1.1 Mt in 2024 (around 4% of its needs). In 2024, Poland imported 27.3 Mt of crude oil (+2.7%). Imports from Russia dropped to only 5% of crude oil imports in 2023, after accounting for 43% in 2022, and 63% in 2021. Saudi Arabia became the second oil supplier in 2022 (30%), followed by Norway, which more than doubled its market share in 2022 from 5% to 13%.
Source: Poland energy report
Interactive Chart Poland Crude Oil Production & Consumption
Source: Global Energy & CO2 data
Interactive Chart Poland Refined Oil Products Production & Consumption
Source: Global Energy & CO2 data
Benefit from up to 2 000 up-to-date data series for 186 countries in Global Energy & CO2 data
Additionally, for more detailed information on refineries, you can request a sample of our EMEA Refineries Dataset
Poland Natural Gas Production & Consumption
Gas production remained stable in 2024, at 5.3 bcm. It remained rather stable, at a slightly higher level (5.5 bcm) between 2010 and 2022; in 2024, it covered 25% of the country's needs.
In 2024, the country imported 15.8 bcm of gas (as in 2023), around 40% of which as LNG.
In 2024, Norway was the first supplier (51%, mostly by pipe), followed by the USA (25%) and Qatar (14%). Russia was the main gas supplier until 2021 (57% in 2021), as imports from Russia were stopped in April 2022 (20% in 2022).
Source: Poland energy report
Interactive Chart Poland Gas Production & Consumption
Source: Global Energy & CO2 data
Benefit from up to 2 000 up-to-date data series for 186 countries in Global Energy & CO2 data
Additionally, for more detailed information on the LNG trade, you can request a sample of our EMEA LNG Trade Dataset
Poland Coal and Lignite Production & Consumption
Production of coal and lignite dropped by 47% between 2022-2024 to reach 85 Mt in 2024 (55% bituminous coal and 45% lignite). Previously it had been stable in 2022, while production fell by 25% between 2010 and 2020 (-10% in 2020) and rebounded by 7%. In 2019, JWS opened the Bzie-Dębina coal mine with recoverable reserves estimated at 180 Mt.
Source: Poland energy report
Interactive Chart Poland Coal and Lignite Production & Consumption
Source: Global Energy & CO2 data
Benefit from up to 2 000 up-to-date data series for 186 countries in Global Energy & CO2 data
View the detailed consumption trends at country level (graphs, tables, analysis) in the Poland energy report
Poland Renewable in % Electricity Production
In the final NECP (July 2025), Poland aims at achieving 32.1% of renewables in gross final energy consumption in 2030 (51.8% for electricity, 36.7% for heating and cooling, 18.9% for transport). In 2024, this share reached 17.8% (33.7% for electricity, 21.3% for heating, and 6% in transport). Within the latest draft NECP projections, wind power plants should have an approximate capacity of 22.5 GW wind in 2030 (onshore 16.6 GW and offshore 5.9 GW).
Source: Poland energy report
Interactive Chart Poland Share of Renewables in Electricity Production (incl hydro)
Source: Global Energy & CO2 data
Benefit from up to 2 000 up-to-date data series for 186 countries in Global Energy & CO2 data
Learn more about renewables in the European Battery Market Analysis
Poland GHG emissions and CO2 emissions
In Its updated draft NECP (July 2025), the country set a reduction target for net GHG emissions of 53.9% compared to 1990, of which 51.1% in the ETS sector and 22% for non ETS (compared to 2005). Poland is the only European Union member country that has not endorsed anet-zero carbon target by 2050. According to a study by the Polish Economic Institute (PEI), Poland could achieve climate neutrality by 2056 under an optimistic scenario. Under a pessimistic scenario, the country would reach net zero emissions by 2067.
Source: Poland energy report
Interactive Chart Poland CO2 emissions
Source: Global Energy & CO2 data
Benefit from up to 2 000 up-to-date data series for 186 countries in Global Energy & CO2 data
View the detailed consumption trends at country level (graphs, tables, analysis) in the Poland energy report