Morocco Key Figures
- Population:
- 38.1 million
- GDP growth rate:
- 3.24 %/year
- Energy independence:
- 11.8%
Data of the last year available: 2024
- Total consumption/GDP:*
- 100 (2015=100)
- CO2 Emissions:
- 1.67 tCO2/cap
- Rate of T&D power losses:
- 19.4%
* at purchasing power parity
View all macro and energy indicators in the Morocco energy report
Morocco Energy News
View all news, archive your new and create your own daily newsletters only on your topics/countries of interest with Key Energy Intelligence
Morocco Energy Research
- Morocco's Energy & Climate Policy Framework: Morocco targets 52% renewables in power mix by 2030, 80% by 2050, and aims to cut GHG emissions by 53% by 2035.
- Morocco's Energy Companies: ONEE dominates Morocco’s electricity sector, operating transmission, half of generation, and distribution. IPPs supply 80% of power. Oil sector relies on imports; coal imports controlled by Sococharbo.
- Morocco's Energy Supply & Demand: Morocco’s energy mix in 2024: 75% thermal (coal dominant), 25% renewables (wind/solar up 22pp since 2010). Heavy import reliance; gas/LNG imports rising post-Algeria supply halt.
- Morocco's Energy Use & Price by Sector: Oil dominates Morocco’s energy mix (73%), with electricity (19%) and biomass (8%). Residential/services sector leads demand (43%), followed by transport (35%) and industry (19%). Fuel subsidies ended in 2015.
- Morocco's Issues & Prospects: Morocco targets 52% renewable energy by 2030, expanding green hydrogen projects to meet rising demand and bolster its African leadership in sustainable energy.
Benefit from up to 2 000 up-to-date data series for 186 countries in Global Energy & CO2 data
A data overview is available in the global energy statistics app
Morocco Total Energy Production & Consumption
Since 2019, primary energy consumption has increased on average by 1%/year (including-5% in 2020 and +7% in 2021 due to the Covid-19 crisis), reaching 23 Mtoe in 2025. Between 2010 and 2019, consumption grew at an average annual rate of 3%.
In 2024, oil remained the primary energy source, accounting for 56% of total consumption (down from 68% in 2010), followed by coal at 28% (+13 percentage points), electricity at 7% (+3 pp), biomass at 6% (-4 pp), and natural gas at 3% (unchanged since 2010).
Source: Morocco energy report
Interactive Chart Morocco Total Energy Production & Consumption
Source: Global Energy & CO2 data
Benefit from up to 2 000 up-to-date data series for 186 countries in Global Energy & CO2 data
View the detailed fondamentals of the market at country level (graphs, tables, analysis) in the Morocco energy report
Morocco Oil Production & Consumption
The production of oil is very low (0.04 kb/d in 2024). All the oil products are imported since the shutdown of the sole refinery of the country in 2015 (200 kb/d). Oil product imports increased by 6% in 2024, to 14 Mt, after a 2% decrease in 2023. They almost doubled between 2010 and 2024.
Petroleum product consumption reached 13 Mt in 2024. Since 2010, consumption has increased at an average rate of 1%/year.
Source: Morocco energy report
Interactive Chart Morocco Crude Oil Production & Consumption
Source: Global Energy & CO2 data
Interactive Chart Morocco Refined Oil Products Production & Consumption
Source: Global Energy & CO2 data
Benefit from up to 2 000 up-to-date data series for 186 countries in Global Energy & CO2 data
Additionally, for more detailed information on refineries, you can request a sample of our EMEA Refineries Dataset
Morocco Natural Gas Production & Consumption
National gas production is very low and declining. It fell by 36% to 30 mcm in 2024, representing 3% of the domestic consumption.
Gas imports reached 0.9 bcm in 2024, up 2% compared with 2023.
After Algeria stopped supplying gas in 2021 via the 12 bcm/year Maghreb-Europe pipeline to Spain and Portugal and, by extension, to Morocco (which was receiving 1 bcm/year of Algerian gas as transit fees), the infrastructure commissioned in 1996 was modified to operate in reverse flow. Since 2022, Morocco imports regasified LNG from Spain.
Source: Morocco energy report
Interactive Chart Morocco Gas Production & Consumption
Source: Global Energy & CO2 data
Benefit from up to 2 000 up-to-date data series for 186 countries in Global Energy & CO2 data
Additionally, for more detailed information on the LNG trade, you can request a sample of our EMEA LNG Trade Dataset
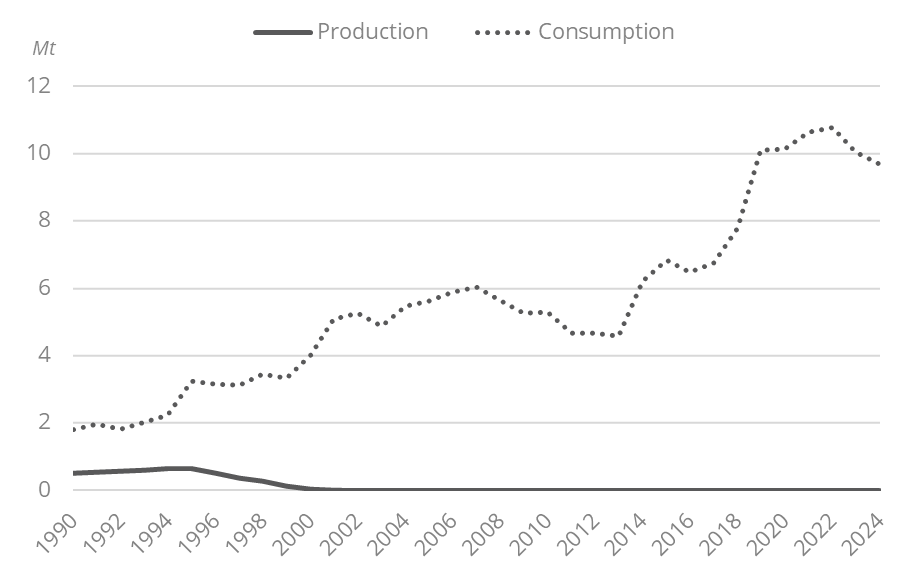
Morocco Coal and Lignite Production & Consumption
Coal production stopped in 2000. Coal imports have doubled since 2010 and have averaged 10 Mt since 2019 (-3% in 2024). Coal is entirely used for the production of electricity.
Graph: Coal Production & Consumption
Source: Morocco energy report
Interactive Chart Morocco Coal and Lignite Production & Consumption
Source: Global Energy & CO2 data
Benefit from up to 2 000 up-to-date data series for 186 countries in Global Energy & CO2 data
View the detailed consumption trends at country level (graphs, tables, analysis) in the Morocco energy report
Morocco Renewable in % Electricity Production
MASEN, the Moroccan Agency for Sustainable Energy, was established in 2010 to manage developments of solar power. Its responsibilities were extended in 2016 to coordinate all renewable projects, including wind and hydro.
The gradual transfer of renewable projects and assets from ONEE to MASEN (initially planned over a transitional period of 5 years starting in 2016) was initiated and, by April 2026, MASEN is acting as the central agency for the planning and development of new renewable energy projects.
Source: Morocco energy report
Interactive Chart Morocco Share of Renewables in Electricity Production (incl hydro)
Source: Global Energy & CO2 data
Benefit from up to 2 000 up-to-date data series for 186 countries in Global Energy & CO2 data
Morocco GHG emissions and CO2 emissions
In its NDC 3.0, the country aims to reduce GHG emissions by 53% by 2035, based on a business-as-usual (BAU) scenario. This includes an unconditional reduction of 21.6% (equivalent to 36 MtCO2eq) compared to 2010 levels, achieved through secured, state-aligned financing, and a conditional reduction of 31.4% dependent on international support.
Source: Morocco energy report
Interactive Chart Morocco CO2 emissions
Source: Global Energy & CO2 data
Benefit from up to 2 000 up-to-date data series for 186 countries in Global Energy & CO2 data
View the detailed consumption trends at country level (graphs, tables, analysis) in the Morocco energy report