Mali Key Figures
- Population:
- 23.8 million
- GDP growth rate:
- 4.72 %/year
- Energy independence:
- 66.1%
Data of the last year available: 2023
- Total consumption/GDP:*
- 93.9 (2015=100)
- CO2 Emissions:
- 0.27 tCO2/cap
- Rate of T&D power losses:
- 12.0%
* at purchasing power parity
View all macro and energy indicators in the Mali energy report
Mali Energy News
View all news, archive your new and create your own daily newsletters only on your topics/countries of interest with Key Energy Intelligence
Mali Energy Research
- Mali's Energy & Climate Policy Framework: Mali's energy policy targets 87% electrification by 2030, with renewables comprising 37% of the power mix. The Ministry of Energy and Water oversees sector regulation, while the National Action Plan SEforALL aims to enhance energy access and efficiency. Vision 2063 outlines long-term goals, including universal electricity access by 2040 through renewable energy expansion. Despite political instability, Mali remains committed to energy sector reforms and climate mitigation targets.
- Mali's Energy Companies: Mali's power sector faces challenges with state-owned EDM struggling financially due to high costs and losses, leading to frequent outages. Generation is shared among EDM, multinational hydropower plants, IPPs, and autoproducers, with thermal power dominating. Transmission and distribution networks have expanded, but demand outstrips supply, prompting reliance on costly backup generators.
- Mali's Energy Supply & Demand: Mali's energy supply has grown significantly since 2010, with installed capacity doubling and oil imports tripling. Total energy consumption rose by 2.5% annually, reaching 6.2 Mtoe in 2023. Biomass remains the primary energy source, though its share has decreased, while oil's share has increased. The country relies entirely on imports for fossil fuels and has expanded its hydroelectric and solar capacity. Electricity generation has increased, but transmission and distribution infrastructure face challenges, leading to higher losses. Oil consumption, primarily for transport and power generation, has also surged, with imports mainly from Côte d’Ivoire and Senegal. GHG emissions have quadrupled since 1990, stabilising around 45 MtCO2eq, with agriculture contributing significantly.
- Mali's Energy Use & Price by Sector: Biomass dominates final energy consumption (62%), though its share has declined since 2010. Oil products and electricity also play significant roles, with residential and services sectors being the largest consumers. Transport demand has surged, while industry consumption has doubled. Oil prices are regulated but not subsidised, and electricity tariffs are controlled to manage costs.
- Mali's Issues & Prospects: Mali is developing hydropower, solar, and wind projects, along with regional interconnections, to meet rising electricity demand. However, political instability and delays have hindered progress on several key projects.
Benefit from up to 2 000 up-to-date data series for 186 countries in Global Energy & CO2 data
A data overview is available in the global energy statistics app
Mali Total Energy Production & Consumption
Total energy consumption has increased by 2.5%/year since 2010, reaching 6.2 Mtoe in 2023. That consumption jumped by nearly 25% in 2010 after the country recorded very high economic growth (~7%). Energy consumption per capita is low, at about 0.3 toe/capitain 2023, compared to the average for Sub-Saharan Africa (0.6 toe/capita).
Graph: Primary Consumption Trends by Energy Source
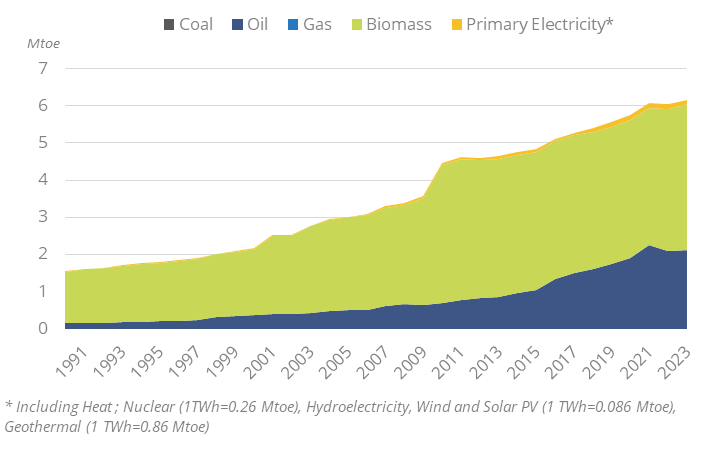
Source: Mali energy report
Interactive Chart Mali Total Energy Production & Consumption
Source: Global Energy & CO2 data
Benefit from up to 2 000 up-to-date data series for 186 countries in Global Energy & CO2 data
View the detailed fondamentals of the market at country level (graphs, tables, analysis) in the Mali energy report
Mali Oil Production & Consumption
The country does not have domestic crude oil production or a refinery.
Mali's consumption of fuel products is entirely met through imports, mainly from Côte d'Ivoire (57% in 2023) and Senegal (37%).
Since 2010, oil product consumption has increased by an average of 10%/year, reaching 2.1 Mt in 2023. Oil products are mostly consumed in the transport sector (61% in 2023), followed by power plants (33%).
Source: Mali energy report
Interactive Chart Mali Crude Oil Production & Consumption
Source: Global Energy & CO2 data
Interactive Chart Mali Refined Oil Products Production & Consumption
Source: Global Energy & CO2 data
Benefit from up to 2 000 up-to-date data series for 186 countries in Global Energy & CO2 data
Additionally, for more detailed information on refineries, you can request a sample of our EMEA Refineries Dataset
Mali Renewable in % Electricity Production
ANERB (National Agency for Renewable Energies and Bioenergies) was established in December 2024 from the merger between AER, the national agency in charge of renewables, and ANADEB, the national body responsible for promoting and developing biofuels. The agency should contribute to the formulation of national strategies, project monitoring, capacity building, as well as the mobilization of funding and international cooperation in this sector.
Source: Mali energy report
Interactive Chart Mali Share of Renewables in Electricity Production (incl hydro)
Source: Global Energy & CO2 data
Benefit from up to 2 000 up-to-date data series for 186 countries in Global Energy & CO2 data
Mali GHG emissions and CO2 emissions
In its updated NDC (2021), Mali set a target to conditionally reduce its GHG emissions by 40% in 2030 compared to a BAU scenario (-31% for energy, -25% for agriculture, -39% for forests, and -31% for waste).
Source: Mali energy report
Interactive Chart Mali CO2 emissions
Source: Global Energy & CO2 data
Benefit from up to 2 000 up-to-date data series for 186 countries in Global Energy & CO2 data
View the detailed consumption trends at country level (graphs, tables, analysis) in the Mali energy report