Lithuania Key Figures
- Population:
- 2.87 million
- GDP growth rate:
- -0.3 %/year
- Energy independence:
- 30.1%
Data of the last year available: 2023
- Total consumption/GDP:*
- 47.8 (2005=100)
- CO2 Emissions:
- 3.98 tCO2/capita
- Rate of T&D power losses:
- 7.10%
* at purchasing power parity
View all macro and energy indicators in the Lithuania energy report
Lithuania Energy News
View all news, archive your new and create your own daily newsletters only on your topics/countries of interest with Key Energy Intelligence
Lithuania Energy Research
Benefit from up to 2 000 up-to-date data series for 186 countries in Global Energy & CO2 data
A data overview is available in the global energy statistics app
Lithuania Total Energy Production & Consumption
Total energy consumption per capita is 2.4 toe and 4 000 kWh for electricity (2023); both are29% below the EU average.
Graph: CONSUMPTION TRENDS BY ENERGY SOURCE (Mtoe)
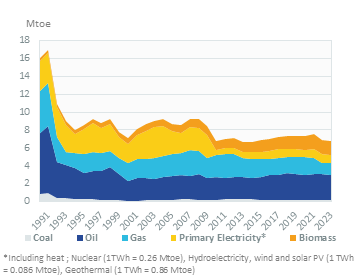
Between 2021 and 2023, total energy consumption decreased by 12%/year (6.8 Mtoe in 2023), after rising by 2% between 2015 and 2021.
The energy intensity to GDP fell by 4%/year between 2000 and 2022, compared to 2%/year in the European Union.
Source: Lithuania energy report
Interactive Chart Lithuania Total Energy Production & Consumption
Source: Global Energy & CO2 data
Benefit from up to 2 000 up-to-date data series for 186 countries in Global Energy & CO2 data
View the detailed fondamentals of the market at country level (graphs, tables, analysis) in the Lithuania energy report
Lithuania Oil Production & Consumption
Apart from a marginal production of around 30 kt, Lithuania imports all its crude oil (9 Mt in 2023, mainly from Saudi Arabia (40%), followed by Norway (27%) and the United States (24%). It is refined at the Mazeikiai refinery which has a capacity of 15 Mt/year, and which operates at around 2/3 of its capacity. The country is a net exporter of oil products (6.9 Mt of exports for 0.9 Mt of imports in 2023).
Source: Lithuania energy report
Interactive Chart Lithuania Crude Oil Production & Consumption
Source: Global Energy & CO2 data
Interactive Chart Lithuania Refined Oil Products Production & Consumption
Source: Global Energy & CO2 data
Benefit from up to 2 000 up-to-date data series for 186 countries in Global Energy & CO2 data
Additionally, for more detailed information on refineries, you can request a sample of our EMEA Refineries Dataset
Lithuania Natural Gas Production & Consumption
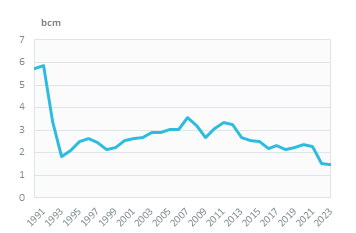
Since a peak in 2007 (3.55 bcm), natural gas consumption has gradually fallen by 5.3%/year, reaching 1.49 bcm in 2023.
Industry accounted for 58% of total gas consumption in 2023 (including non-energy uses, mainly fertiliser production), followed by the residential-tertiary sector (23%) and power plants (10%).
Graph: NATURAL GAS CONSUMPTION (bcm)
Graph: GAS CONSUMPTION BREAKDOWN BY SECTOR (2023, %)
Source: Lithuania energy report
Interactive Chart Lithuania Gas Production & Consumption
Source: Global Energy & CO2 data
Benefit from up to 2 000 up-to-date data series for 186 countries in Global Energy & CO2 data
Additionally, for more detailed information on the LNG trade, you can request a sample of our EMEA LNG Trade Dataset
Lithuania Coal and Lignite Production & Consumption
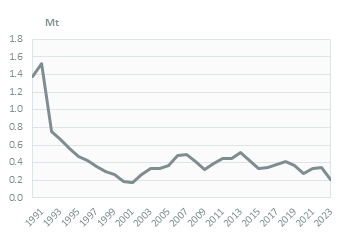
Coal consumption dropped by 40% in 2023 (0.2 Mt), after fluctuating around 0.4 Mt between 2005 and 2022.
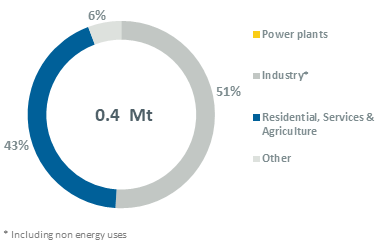
Buildings (residential-services sector) absorb 38% of the consumption, while industry (mainly non-metallic minerals) accounts for 57% (2023).
Graph: COAL CONSUMPTION (Mt)
Graph: COAL CONSUMPTION BREAKDOWN BY SECTOR (2023, %)
Source: Lithuania energy report
Interactive Chart Lithuania Coal and Lignite Production & Consumption
Source: Global Energy & CO2 data
Benefit from up to 2 000 up-to-date data series for 186 countries in Global Energy & CO2 data
View the detailed consumption trends at country level (graphs, tables, analysis) in the Lithuania energy report
Lithuania Power Production & Consumption
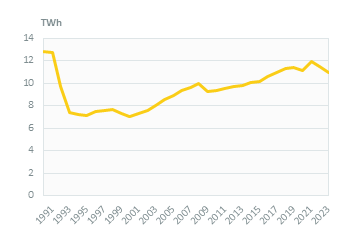
Electricity demand decreased by 4%/year between 2021 and 2023 (11 TWh), after a 2.3%/year increase between 2010 and 2021.
Graph: ELECTRICITY CONSUMPTION (TWh)
Industry absorbs 31% of electricity consumption, services 31%, and the residential sector 28% (2023). Those shares have remained broadly stable since 2000.
Graph: ELECTRICITY CONSUMPTION BREAKDOWN BY SECTOR (2023,%)
Source: Lithuania energy report
Interactive Chart Lithuania Power Production & Consumption
Source: Global Energy & CO2 data
Benefit from up to 2 000 up-to-date data series for 186 countries in Global Energy & CO2 data
View the detailed consumption trends at country level (graphs, tables, analysis) in the Lithuania energy report
Lithuania Renewable in % Electricity Production
The target of the National Renewable Energy and Climate Action Plan of a 23% share of renewables in final energy consumption has been exceeded since 2016. The target set for renewables in 2030 in the updated NECP Draft is 55% of final consumption. In 2023, the share of renewables was 32%, of which 54% for heating, 37% for power, and 7% for transport.
In 2021, the government announced the expected investment (€10 bn) to bring the share of green power to 50% by 2025 and 100% by 2050.
Source: Lithuania energy report
Interactive Chart Lithuania Share of Renewables in Electricity Production (incl hydro)
Source: Global Energy & CO2 data
Benefit from up to 2 000 up-to-date data series for 186 countries in Global Energy & CO2 data
Learn more about renewables in the European Battery Market Analysis
Lithuania GHG emissions and CO2 emissions
GHG emissions have remained broadly stable since 2009, but fell by 60% between 1990 and 2022 (18.9 Mt). They had decreased by nearly 60% between 1990 and 2000 and risen by 30% between 2000 and 2007, offset by significant drops in 2008 and 2009.
Lithuania aims to cap the increase in GHG emissions in sectors covered by the EU ETS to 15% compared to the 2005 level (15.5 MtCO2eq). Ahead of the COP 21, Lithuania's NDC includes a binding GHG emission reduction of 55% by 2030 compared to 1990.
Source: Lithuania energy report
Interactive Chart Lithuania CO2 emissions
Source: Global Energy & CO2 data
Benefit from up to 2 000 up-to-date data series for 186 countries in Global Energy & CO2 data
View the detailed consumption trends at country level (graphs, tables, analysis) in the Lithuania energy report